The study being referenced here assesses the relationship between m...
The study being referenced is ["Some preliminary findings on physic...
To give you a sense, according to the *Center for Disease Control a...
In this study, Youngstedt and Kripke reference a data set of *1.1* ...
Recently, Fitbit (a company that manufactures activity trackers) re...
The Beck Depression Inventory, created by American psychiatrist Aar...
Benzodiazepines are a class of psychoactive drugs whose core chemic...
### Primer on Hazard Ratios
**Hazard Ratios** are commonly used ...
In the United States, the usage of sleep aids has been rising for t...
**Slow-wave sleep** (SWS), also commonly referred to as deep sleep...

SLEEP, Vol. 30, No. 10, 2007
1245
INTRODUCTION
ABOUT 40 YEARS AGO, THE FIRST REPORT ON THE
ASSOCIATION BETWEEN SLEEP LENGTH AND SUBSE-
QUENT MORTALITY INDICATED A U-SHAPED CURVE,
showing that those sleeping 7 hours had the lowest mortality.
1
The
U-shaped association between sleep length and mortality has been
found in most of the nearly 20 published epidemiologic studies.
2
The significance of short sleep has generally decreased or disap-
peared after adjustment for factors known to be associated with
mortality, such as smoking, alcohol use, and physical inactivity. As
for long sleep, Youngstedt and Kripke concluded that “studies with a
relative large number of subjects (>10,000) have without exception
shown that sleep of 8 hours or longer is associated with a significant
mortality risk.”
2
While this excess risk has been rather robust to ad-
justment for lifestyle and other factors, its precise nature and extent
still remain obscure. Earlier studies have not investigated the effect
of stability in sleep length on subsequent mortality.
Other aspects of sleep behavior (such as sleep quality) and the
association to mortality have been little investigated. Increased
risk of mortality associated with the use of medication for sleep
has been reported.
3,4
However, it is not clear which medications
(prescribed hypnotics or nonprescribed sleep promoting agents)
might account for this.
5
The only study with verification of the
drugs being taken indicated that sedative-hypnotics are not as-
sociated with increased mortality risk.
6
Our objective was to continue to probe the relationship be-
tween these 3 aspects of sleep behavior (self-report of sleep
length, sleep quality, and use of sleep promoting medication),
changes in behavior, and mortality in a large, prospective, popu-
lation-based cohort of Finnish adults with 22-year mortality fol-
low-up data and detailed information on potential confounding or
effect-modifying factors.
METHODS
The Finnish Twin Cohort
The Older Finnish Twin Cohort consists of all Finnish twin
pairs of the same sex born before 1958 with both co-twins alive in
1975. These twin pairs were selected from the Central Population
Registry of Finland in 1974.
7
The Cohort includes adult twins and
individuals who were not twins, because twin candidates were
selected by identifying pairs of persons with the same surname
at birth, the same birth date, and the same community at birth.
Biological twinship was confirmed from a questionnaire and local
parish birth records.
The first questionnaire was mailed in autumn 1975, and the
response rate was 89%. The 97-item questionnaire included ques-
tions on sociodemographics, health status, lifestyle and psycho-
social factors, and sleep patterns. In autumn 1981, a second ques-
tionnaire including 100 similar items (response rate 84%) was
mailed to the twins that had responded to the first questionnaire;
Sleep and Mortality: A Population-Based 22-Year Follow-Up Study
Christer Hublin, MD, PhD
1
; Markku Partinen, MD, PhD
2
; Markku Koskenvuo, MD, PhD
3
; Jaakko Kaprio, MD, PhD
3,4
1
Brain@Work Research Center, Finnish Institute of Occupational Health, Helsinki, Finland;
2
Skogby Sleep Clinic, Rinnekoti Foundation, Espoo,
Finland;
3
Dept. of Public Health, University of Helsinki, Helsinki, Finland;
4
Department of Mental Health and Alcohol Research, National Public
Health Institute, Helsinki, Finland
Sleep and Mortality—Hublin et al
Disclosure Statement
This was not an industry supported study. The authors have reported no
financial conflicts of interest.
Submitted for publication September, 2006
Accepted for publication June, 2007
Address correspondence to: Christer Hublin, Brain@Work Research Center,
Finnish Institute of Occupational Health, Topeliuksenkatu 41 a A, FIN-00250
Helsinki, Finland; E-mail: christer.hublin@ttl.fi
Study Objectives: Long and short sleep have been associated with in-
creased mortality. We assessed mortality and 3 aspects of sleep behavior
in a large cohort with 22-year follow-up.
Design/Setting: Prospective, population-based cohort study.
Participants: 21,268 twins aged ≥18 years responding to questionnaires
administered to the Finnish Twin Cohort in 1975 (response rate 89%), and
1981 (84%).
Interventions: N/A
Measurements: Subjects were categorized as short (<7 h), average, or
long (>8 h) sleepers; sleeping well, fairly well, or fairly poorly/poorly; no,
infrequent, or frequent users of hypnotics and/or tranquilizers. Cox propor-
tional hazard models were used to obtain hazard ratios (HR) for mortality
during 1982-2003 by sleep variable categories and their combinations.
Adjustments were done for 10 sociodemographic and lifestyle covariates
known to affect risk of death.
Results: Significantly increased risk of mortality was observed both for
short sleep in men (+26%) and in women (+21%), and for long sleep
(+24% and +17%), respectively, and also frequent use of hypnotics/tran-
quilizers (+31% in men and +39% in women). Snoring as a covariate did
not change the results. The effect of sleep on mortality varied between
age groups, with strongest effects in young men. Between 1975 and
1981, sleep length and sleep quality changed in one-third of subjects.
In men there was a significant increase for stable short (1.34) and stable
long (1.29) sleep for natural deaths, and for external causes in stable
short sleepers (1.62).
Conclusions: Our results show complicated associations between sleep
and mortality, with increased risk in short and long sleep.
Keywords: Follow-up study, mortality, population, sleep, hypnotics
Citation: Hublin C; Partinen M; Koskenvuo M; Kaprio J. Sleep and mortal-
ity: a population-based 22-year follow-up study. SLEEP 2007;30(10):1245-
1253.
SLEEP DURATION AND MORTALITY

SLEEP, Vol. 30, No. 10, 2007
1246
non-twins were not contacted. The present analyses include those
twin individuals responding to both questionnaires with informa-
tion on sleep length and sleep quality, and resident in Finland in
1981 (N = 21,268; 52.3% women; mean age in 1981, 40.7 years,
SD 13.5 years, range 24-101 years).
The study was approved by the ethical committee of the De-
partment of Public Health, University of Helsinki. Informed con-
sent was obtained from all respondents.
Questionnaire Data
Information on sleep length was obtained by asking “How many
hours do you usually sleep per 24 hours?” In 1975 seven response
alternatives were used (<4 hours, 5, 6, 7, 8, 9, and ≥10 hours), and in
1981 nine alternatives (≤6 hours, 6.5, 7, 7.5, 8, 8.5, 9, 9.5, and ≥10
hours). Information on quality of sleep was obtained both in 1975
and 1981 by asking: “Do you usually sleep well?” The 5 response
alternatives were: “well,” “fairly well,” “fairly poorly,” “poorly,”
and “cannot say.” Use of hypnotics and use of tranquilizers were
included in both questionnaires in the question “On how many days
in total during the last year have you used the following types of
medications?” with alternatives “no use,” “on less than 10 days,”
“on 10-59 days,” “on 60-180 days,” and “on more than 180 days.”
We included tranquilizers in our analyses because they are widely
used interchangeably with hypnotics in clinical practice, and the
majority of the compounds in both groups have similar pharma-
cological profile (they are benzodiazepines or benzodiazepine-like
agents acting on the GABA system in the brain).
We assessed the following sociodemographic and lifestyle co-
variates (asked both in 1975 and 1981; selected characteristics
given in Table 1): married (yes/no), social class (6 categories: up-
per or lower white collar, skilled or unskilled workers, farmers,
others), education (9 categories by years of school, high school
equals to 12 years), working status (employed yes/no), BMI
[body mass index (kg/m
2
) computed from self-reported weight
and height], smoking status (4 categories: never, occasional, ex-,
or current cigarette smoker), binge drinking,
8
grams of alcohol
consumed daily (based on self-reported average quantities of
use of beer, wine, and spirits consumed
9
), conditioning physical
activity (3 categories: sedentary, intermediate, vigorous physi-
cal activity
10
), and life satisfaction.
11
Life satisfaction correlates
highly (r = - 0.63) with depression as assessed concurrently by
the Beck Depression Inventory.
12
Snoring was asked in 1981 only
with response alternatives “never,” “occasionally,” “often,” “al-
most always,” and “do not know.”
Follow-up Data
Vital status (alive in Finland on December 31, 2003, date of
death, or date of migration from Finland) was obtained from the
Population Register Centre of Finland. The follow-up for mortal-
ity was from the exact date of response (date questionnaire re-
turned) to December 31, 2003. The follow-up time is denoted in
Tables as 1982-2003. Our analyses are based on 431,782 person-
years and 3700 deaths during follow-up. Cause-of-death statis-
tics up to the end of 2003 were obtained from Statistics Finland.
Both registers cover all Finnish citizens and permanent residents.
These data were linked to the Finnish Twin Cohort data using
the unique personal identification numbers assigned to every per-
manent resident of Finland. Deaths were categorized as natural
(ICD-8 and ICD-9 codes 1-799, or ICD-10 codes A-R) or due to
external causes (violent deaths; ICD-8 and ICD-9 codes 800-999,
or ICD-10 codes S-Y.)
Data Analysis and Statistical Methods
Cox proportional hazard models were used to obtain hazard ra-
tios (HR) and their 95% confidence intervals (CI) for mortality by
Sleep and Mortality—Hublin et al
Table 1—Selected Demographic Characteristics in 1981 of the Entire Cohort with Complete Sleep Behavior Data. Percentage of Those in the
Specified Category of Potential Confounder; Number of Men/Women Given in Column Header
Use Of Hypnotics And/or
Sleep Length* Sleep Quality Tranquilizers**
Short Average Long Sleeping Sleeping Sleeping fairly No Infrequent Frequent
N (m/f) = N (m/f) = N (m/f) = well fairly well poorly/poorly N (m/f) = N (m/f) = N (m/f) =
1539 / 1500 7113 / 7247 1488 / 2381 N(m/f) = N (m/f) = N (m/f) = 8209 / 8329 454 / 776 261 / 347
4388 / 4586 4804 / 5486 948 / 1056
Age
24-39 years 52.1 / 44.7 56.8 / 56.4 52.8 / 57.3 62.7 / 64.5 52.3 / 51.4 38.3 / 32.0 60.9 / 62.3 40.8 / 46.4 35.3 / 34.3
40-54 years 30.2 / 25.3 29.5 / 26.3 25.6 / 22.3 26.0 / 23.2 30.7 / 27.0 34.4 / 25.9 27.7 / 23.7 37.9 / 29.1 36.8 / 29.1
55 years or more 17.7 / 30.1 13.7 / 17.3 21.6 / 20.5 11.3 / 12.3 17.0 / 21.6 27.3 / 42.1 11.4 / 14.0 21.4 / 24.5 28.0 / 36.6
Married 70.1 / 58.4 74.7 / 68.5 68.4 / 66.8 74.4 / 66.6 72.7 / 67.7 69.0 / 62.5 73.7 / 69.1 73.6 / 63.7 58.2 / 47.0
Employed 82.5 / 76.6 87.8 / 85.1 75.0 / 76.1 89.9 /87.0 84.5 / 81.4 65.9 / 63.7 90.0 / 86.7 76.2 / 79.6 41.0 / 51.6
Social class: skilled and
unskilled workers 63.3 / 48.9 55.7 / 42.2 51.1 / 42.6 54.1 / 39.6 57.3 / 45.0 60.0 / 49.3 56.0 / 42.3 54.2 /37.3 45.6 / 43.2
Education: high school
or more 8.2 / 10.8 12.8 / 16.4 11.8 / 13.0 13.8 / 18.9 11.1 / 13.1 7.9 / 7.4 12.9 / 16.7 15.2 / 20.5 10.3 / 12.2
Current smoker 47.6 / 24.5 35.5 / 19.9 30.3 / 16.3 35.9 / 21.7 35.2 / 18.3 43.2 / 18.5 36.7 / 20.8 42.8 / 21.5 40.1 / 26.5
Binge drinker 47.0 / 10.8 41.3 / 8.8 37.1 / 8.6 37.2 / 8.4 43.8 / 9.3 50.2 / 10.6 42.1 / 9.2 48.9 / 13.1 38.1 / 12.0
BMI*** ≥25 42.0 / 30.9 38.1 / 24.5 41.7 / 26.5 37.5 / 21.1 40.1 / 27.4 42.8 / 37.8 37.3 / 22.3 40.7 / 26.1 52.5 / 37.9
Sedentary 15.4 / 15.8 11.8 /11.3 14.5 /13.2 13.3 / 11.9 11.3 / 11.7 17.6 / 16.8 12.5 / 11.8 11.7 / 13.0 15.3 / 17.6
Low life satisfaction 23.3 / 23.9 14.1 / 14.5 18.2 / 16.0 9.8 / 10.3 17.4 / 17.1 39.0 / 36.4 13.6 / 13.0 30.0 / 28.7 46.4 / 43.6
Deceased 1982-2003 27.1 / 24.7 17.2 / 12.4 25.7 / 16.9 15.0 / 10.9 21.2 / 15.5 36.8 / 30.9 15.5 / 10.8 29.3 / 16.4 42.9 / 35.2
* short = <7 hours, average = 7-8 hours, and long = >8 hours; ** infrequent use = 1-59 days/year; frequent use = 60 or more days/year; *** body
mass index
SLEEP, Vol. 30, No. 10, 2007
1247
sleep length, sleep quality, and the use of hypnotics and/or tran-
quilizers. We ascertained that the proportional-hazards assumption
was not violated by using log-log plots, (i.e. -ln{-ln(survival)}
curves versus ln(analysis time) of survival curves of the 3 cat-
egories of sleep length, sleep quality, and use of hypnotics and/or
tranquilizers, to check that the curves were parallel. Because the
study sample included twin pairs, standard errors and CIs were
adjusted for possible within-pair correlations using robust esti-
mators of variance.
13
All statistical analyses were performed with
Stata version 9.2 (Stata Corporation, College Station, TX, USA).
Sleep length was categorized in 3 classes: short (< 7 hours),
average (7-8 hours), and long (> 8 hours). Sleep quality was also
dealt with in 3 categories (well, fairly well, and fairly poorly/poor-
ly). Use of hypnotics and/or tranquilizers was similarly assessed
in 3 categories (no use of either hypnotics or tranquilizers, infre-
quent use = 1-59 days per year of either medication, frequent use
= 60 or more days per year of either medication). Because some
subjects had missing data on use of both hypnotics and tranqui-
lizers, we created a fourth category for those with missing data.
This was included in the modelling in order not to lose subjects,
but results for this class are not shown. Subjects in the reference
group had average sleep length, slept well, and used no hypnotics
and/or tranquilizers.
The association between mortality and the stability of the 3 sleep-
related variables (sleep length, sleep quality, and use of hypnotics
and/or tranquilizers) was assessed using combinations of categories
(3 alternatives both in 1975 and 1981 giving 9 subgroups in each
sleep related variable) in modeling. Age-adjusted HRs for total
mortality are given, and results for men and women are presented
separately because of significant gender differences.
Gender by sleep behavior interactions were tested by assessing
the difference in model fit between a model with gender by sleep
variable interactions (all 3 variables) compared with a model with
main effects of the sleep variables and sex alone. The difference
in model fit is chi-square distributed. This likelihood ratio test
chi-square probability for overall presence of any sex-interactions
was 0.07 in the youngest age-group; correspondingly for the age
group 40-54 years 0.34 and for 55+ years 0.59, and for the total
population 0.03 (Table 10).
In fully-adjusted models, adjustments were made for the so-
ciodemographic and lifestyle covariates (measured in 1981)
known to affect risk of death (see “Questionnaire data” above).
Subjects with missing data on any of the covariates (N given in
each Table) were excluded from the fully-adjusted models. When
a sleep-related variable was not dependent, it was included as a
covariate in the model. The effect of snoring (3 categories: never,
occasionally, and often/almost always) was also assessed by sepa-
rate models. The joint effects of sleep related variables measured
in 1981 were also assessed.
RESULTS
Descriptive data of the study population is given in Table 1 by
categories of the self-reported sleep length, sleep quality, and use
of hypnotics and/or tranquilizers. In the last row, the percentage of
deaths in each category is given; it is lowest in those with average
sleep length, sleeping well, and no use of hypnotics and/or tranqui-
lizers. Covariates have been surveyed both in 1975 and 1981 and
their stability was variable: the kappa-value of, e.g., for being mar-
ried was 0.56, level of education 0.89, binge drinking 0.57, ciga-
rette smoking 0.70, overweight (BMI ≥25) 0.67, sedentary physical
activity 0.30, low life satisfaction 0.26, and being employed 0.45.
There was information on the frequency of use of hypnotics
and/or tranquilizers in 1975 and 1981 in 86.4% of the study popu-
lation. Of all users (N = 1881) 22.9% used only hypnotics, 48.3%
only tranquilizers, and 28.8 % used both types of medication.
To assess the interrelationships between sleep length, sleep qual-
ity, and use of hypnotics and/or tranquilizers (medication) poly-
choric correlation matrices of the 3-class variables measured in
1975 and 1981 were computed, and all correlations in both genders
were statistically significant (P ≤0.02). In men the correlation be-
tween 1975 and 1981 in sleep length was 0.49 (kappa-value 0.25),
in sleep quality 0.64 (0.40), and in use of medication 0.43 (0.21); in
women 0.50 (0.27), 0.63 (0.38), and 0.44 (0.22), correspondingly.
Risk of mortality by each sleep variable category is given
in Table 2. In the fully-adjusted model, there was a significant
increase in mortality in the 2 genders in both short and in long
sleepers: 26% in men and 21% in women for short sleep, and for
long sleep 24% and 17%, respectively. Sleep quality (sleeping
worse than well) was significant only in men in the age-adjusted
model, indicating no independent association between sleep qual-
ity and mortality. Frequent use of hypnotics and/or tranquilizers
significantly increased risk of mortality by 31% in men and by
39% in women. Including snoring as a covariate or exclusion of
deaths during the first 3 years of follow-up (up to the end of 1985)
did not essentially change the HRs or the statistical significance.
Table 3 shows age-adjusted risk of total mortality by age groups
separately for men and women in different sleep variable catego-
ries. In men, short sleep was significantly associated with increased
risk in all ages, most clearly in the youngest group (+ 96%). In
women there was a similar but nonsignificant trend. Sleep quality
significantly affected the risk only in young men with an increase
of 129% in those sleeping fairly poorly/poorly. Frequent use of
hypnotics and/or tranquilizers was associated with increased risk
of mortality in all age groups in both genders (even more clearly
in men), but the effect attenuated with age (HRs in the youngest
group in men 2.90 and in women 2.57, in the oldest group 1.38
and 1.50, respectively). In the fully-adjusted model the HRs were
clearly attenuated and half of the significant hazard ratios became
nonsignificant, and the pattern of decreasing HRs related to sleep
abnormalities with increasing age was mainly lost. Due to smaller
numbers of subjects in the age-group specific analyses, the power
to detect differences was less than in the overall sample.
Table 4 shows the association between stability of sleep length
and total mortality. Length category remained unchanged in
68.8% of men and in 66.2% of women from 1975 to 1981, and re-
spectively, sleep shortened in 16.6% and 16.7% and lengthened in
14.6% and 17.1%. In both age-adjusted and fully-adjusted mod-
els in men, but not in women, stable short (HR 1.36) and stable
long (1.32) sleep was associated with a significantly increased
risk of mortality. A decrease of sleep length to short resulted in
significantly increased mortality in women (1.24-2.17), and there
was a similar trend in men. Lengthening of sleep from average
to long significantly increased risk of mortality in both genders
(about 1.20). Thus, in men there was a U-shaped association with
significantly increased risk of mortality in short and long sleepers
at the beginning of the follow-up, but in women the pattern was
less clear, but with some significant associations. Including snor-
ing as a covariate in the fully-adjusted model did not significantly
change the HRs otherwise, but in men the category average to
Sleep and Mortality—Hublin et al

SLEEP, Vol. 30, No. 10, 2007
1248
short decreased from 1.20 to 1.15 and became nonsignificant. Ex-
cluding sleep quality and use of hypnotics and/or tranquilizers as
covariates did not change HRs substantially.
Table 5 gives the mortality risks (HRs) on the association be-
tween stability of sleep quality and total mortality. Sleep quality
from 1975 to 1981 remained unchanged in 65.6% of men and in
64.5% of women and became worse in about 20% and better in
about 15% in both genders. There was a gender difference in age-
adjusted model showing significant increases in risk of mortality
in men in most combinations of sleep quality (highest with fairly
poor/poor quality either in 1975 or 1981, 1.72-1.98), but in the ful-
ly-adjusted model, almost all associations lost their significance
indicating that the effect of sleep quality is not an independent
effect but reflects the influence of other factors affecting mortal-
ity. Snoring as a covariate made all HRs nonsignificant (fairly
poorly/poorly-fairly well decreased from 1.34 to 1.19 in men).
Excluding sleep length and use of hypnotics and/or tranquilizers
as covariates did not change HRs substantially.
Table 6 gives the results on the association between stability of
use of hypnotics and/or tranquilizers and the risk of mortality. The
majority (87.6% of men and 81.8% of women) did not use these
medications either in 1975 or in 1981. Use remained unchanged in
Sleep and Mortality—Hublin et al
Table 2—Sleep Length, Sleep Quality, Use of Hypnotics and/or Tranquilizers, and Risk of Total Mortality (Hazard Ratio and 95% Confidence
Interval) in 1982-2003. All Three Sleep Variables Mutually Adjusted in the Same Model and Measured in 1981
All-Cause Mortality In 1982-2003
Age-adjusted Age-adjusted Fully-adjusted Fully-adjusted
(men) (women) model (men) model (women)
N = 10140 N = 11128 N = 9529 N = 10265
Sleep Length*
short 1.34 (1.19, 1.51) 1.12 (0.98, 1.28) 1.26 (1.11, 1.43) 1.21 (1.05, 1.40)
average 1.00 1.00 1.00 1.00
long 1.32 (1.17, 1.48) 1.20 (1.06, 1.35) 1.24 (1.09, 1.41) 1.17 (1.03, 1.34)
Sleep Quality
sleeping well 1.00 1.00 1.00 1.00
sleeping fairly well 1.14 (1.03, 1.25) 0.95 (0.85, 1.07) 1.04 (0.93, 1.17) 0.93 (0.82, 1.05)
sleeping fairly poorly/poorly 1.31 (1.12, 1.53) 1.03 (0.88, 1.21) 1.08 (0.91, 1.29) 0.93 (0.78, 1.12)
Use Of Hypnotics And/Or
Tranquilizers**
no 1.00 1.00 1.00 1.00
infrequent 1.17 (0.95, 1.43) 0.98 (0.81, 1.19) 1.10 (0.89, 1.36) 1.01 (0.83, 1.25)
frequent 1.71 (1.36, 2.16) 1.64 (1.32, 2.03) 1.31 (1.02, 1.69) 1.39 (1.11, 1.75)
*short = < 7 � .
Covariates measured in 1981 (in addition to age) in fully-adjusted model: education, marital status, working status, social class, BMI, smoking
status, binge drinking, grams of alcohol consumed daily, conditioning physical activity, and life satisfaction.
Table 3—Sleep Length, Sleep Quality, Use of Hypnotics and/or Tranquilizers, and Risk of Total Mortality (Age-Adjusted Hazard Ratio and 95%
Confidence Interval) in 1982-2003 by Age Groups (Age at Entry of the Follow-Up). All 3 Variables Measured in 1981 and Mutually Adjusted in
the Same Model
24-39 Years 40-54 Years 55 Years Or More
Men Women Men Women Men Women
N = 5629 N = 6118 N = 2941 N = 2818 N = 1570 N = 2192
Sleep Length*
short 1.96 (1.53, 2.51) 1.52 (0.99, 2.33) 1.29 (1.03, 1.62) 1.23 (0.88, 1.74) 1.19 (1.01, 1.40) 1.07 (0.92, 1.23)
average 1.00 1.00 1.00 1.00 1.00 1.00
long 1.33 (0.98, 1.79) 1.45 (1.03, 2.04) 1.06 (0.82, 1.37) 1.31 (0.97, 1.76) 1.37 (1.18, 1.60) 1.13 (0.98, 1.30)
Sleep Quality
sleeping well 1.00 1.00 1.00 1.00 1.00 1.00
sleeping fairly well 1.36 (1.09, 1.69) 0.98 (0.72, 1.34) 1.15 (0.96, 1.38) 1.00 (0.77, 1.30) 1.03 (0.89, 1.18) 0.91 (0.79, 1.05)
sleeping fairly
poorly/poorly 2.29 (1.62, 3.24) 1.42 (0.83, 2.44) 1.26 (0.95, 1.68) 1.12 (0.73, 1.70) 1.18 (0.96, 1.45) 0.98 (0.82, 1.17)
Use Of Hypnotics
And/or Tranquilizers**
no 1.00 1.00 1.00 1.00 1.00 1.00
infrequent 1.68 (1.08, 2.61) 1.45 (0.85, 2.47) 1.50 (1.11, 2.05) 1.07 (0.70, 1.64) 0.87 (0.65, 1.16) 0.89 (0.71, 1.13)
frequent 2.90 (1.76, 4.76) 2.57 (1.27, 5.21) 2.07 (1.43, 3.01) 1.94 (1.21, 3.13) 1.38 (1.01, 1.88) 1.50 (1.18, 1.92)
* short = < 7 � .

SLEEP, Vol. 30, No. 10, 2007
1249
2.7% of men and in 4.0% of women, and, respectively, increased in
4.0% and 7.2%, and decreased in 4.7% and 7.1%. In age-adjusted
HRs, there was increased mortality risk in recent frequent use (in
men 1.63-2.17 and in women 1.47-2.24), which in the fully-adjust-
ed model attenuated clearly in men and somewhat in women. The
increase in mortality was most consistent and significant in those
who were non-users of hypnotics and/or tranquilizers in 1975 who
reported frequently use in 1981. There was no change in the HRs
when including snoring as a covariate. Excluding sleep length and
sleep quality as covariates did not change HRs substantially.
Joint effects of sleep length and sleep quality on total mortal-
ity in 1981 are shown in Table 7. In the fully-adjusted model in
men there was a significant increase in mortality in short sleepers
in all 3 quality categories (1.32-1.45), and in 2 of 3 classes of
long sleepers (1.26-1.42, but not in the poorest quality class). In
women the only significant HR was in short sleepers with good
sleep quality. The results are parallel with those of the stability of
sleep length (Table 4). Snoring as a covariate slightly lowered the
HRs in men, leading to nonsignificance in the categories of short
and fairly poorly/poorly (from 1.33 to 1.22), and long and fairly
well (from 1.26 to 1.17).
Table 8 gives the HRs for joint effects of sleep quality and the
use of hypnotics and/or tranquilizers. In the small group sleeping
well and taking medication frequently, the estimates of risk of
Sleep and Mortality—Hublin et al
Table 4—Stability of Sleep Length Between 1975 and 1981 and Total Mortality in 1982-2003: Hazard Ratios with 95% Confidence Intervals.
Percentage of Subjects in Each Sleep Length Category Combination Given for Men and Women.
Sleep length* Percentage All-Cause Mortality 1982-2003
Age-adjusted Age-adjusted Fully-adjusted Fully-adjusted
1975 1981 Men Women (men) (women) model (men) model (women)
N = 10140 N = 11128 N = 9529 N = 10265
Short Short 5.0 4.3 1.60 (1.36, 1.89) 1.07 (0.90, 1.28) 1.36 (1.13, 1.63) 1.07 (0.86, 1.32)
Average Short 9.7 8.5 1.44 (1.25, 1.67) 1.22 (1.05, 1.42) 1.20 (1.02, 1.41) 1.24 (1.05, 1.48)
Long Short 0.5 0.7 2.43 (1.51, 3.89) 2.08 (1.18, 3.67) 1.63 (0.89, 2.99) 2.17 (1.33, 3.53)
Short Average 4.5 3.8 1.48 (1.20, 1.82) 1.03 (0.83, 1.29) 1.19 (0.94, 1.49) 0.94 (0.74, 1.18)
Average Average 59.2 53.8 1.00 (reference) 1.00 (reference) 1.00 (reference) 1.00 (reference)
Long Average 6.4 7.5 0.97 (0.80, 1.18) 1.02 (0.81, 1.27) 0.90 (0.72, 1.12) 0.98 (0.77, 1.25)
Short Long 0.4 0.5 1.47 (0.78, 2.78) 1.73 (1.04, 2.86) 1.25 (0.63, 2.47) 1.34 (0.77, 2.34)
Average Long 9.7 12.8 1.27 (1.11, 1.47) 1.18 (1.02, 1.36) 1.20 (1.03, 1.40) 1.19 (1.02, 1.40)
Long Long 4.6 8.1 1.49 (1.24, 1.78) 1.21 (1.00, 1.46) 1.32 (1.07, 1.62) 1.09 (0.89, 1.35)
*short = < 7 hours, average = 7-8 hours, and long = > 8 hours.
Covariates measured in 1981 (in addition to age) in fully-adjusted model: education, marital status, working status, social class, BMI, smoking
status, binge drinking, grams of alcohol consumed daily, conditioning physical activity, life satisfaction, sleep quality, and use of hypnotics and/or
tranquilizers.
Table 5—Stability of Sleep Quality Between 1975 and 1981 and Total Mortality in 1982-2003: Hazard Ratios (95% Confidence Intervals) for Each
Combination of Self-Reported Sleep Quality. Percentage of Subjects in Each Sleep Quality Category Combination Given for Men and Women
Sleep Quality: Sleeping Percentage All-Cause Mortality 1982-2003
Age-adjusted Age-adjusted Fully-adjusted Fully-adjusted
1975 1981 Men Women (men) (women) model (men) model (women)
N = 10140 N = 11128 N = 9529 N = 10265
Well Well 31.3 28.9 1.00 (reference) 1.00 (reference) 1.00 (reference) 1.00 (reference)
Fairly well Well 11.4 11.6 1.26 (1.07, 1.48) 1.11 (0.92, 1.34) 1.15 (0.96, 1.38) 1.04 (0.85, 1.28)
Fairly poorly/ Well 0.6 0.7 1.87 (1.24, 2.82) 1.40 (0.90, 2.17) 1.08 (0.71, 1.63) 1.03 (0.62, 1.71)
poorly
Well Fairly well 14.7 14.6 1.13 (0.97, 1.32) 0.99 (0.82, 1.19) 1.06 (0.90, 1.26) 0.96 (0.78, 1.18)
Fairly well Fairly well 30.1 31.5 1.23 (1.09, 1.39) 0.97 (0.84, 1.12) 1.08 (0.94, 1.24) 0.92 (0.78, 1.09)
Fairly poorly/ Fairly well 2.6 3.2 1.98 (1.58, 2.49) 1.22 (0.97, 1.53) 1.34 (1.03, 1.74) 1.01 (0.78, 1.31)
poorly
Well Fairly poorly/ 1.1 0.8 1.72 (1.08, 2.73) 0.89 (0.54, 1.46) 1.12 (0.69, 1.81) 0.54 (0.30, 0.99)
poorly
Fairly well Fairly poorly/ 4.1 4.6 1.76 (1.43, 2.16) 1.24 (1.02, 1.52) 1.19 (0.93, 1.51) 0.99 (0.77, 1.26)
poorly
Fairly poorly/ Fairly poorly/ 4.1 4.1 1.73 (1.43, 2.09) 1.18 (0.98, 1.42) 1.10 (0.87, 1.39) 0.99 (0.77, 1.27)
poorly poorly
Covariates measured in 1981 (in addition to age) in fully-adjusted model: education, marital status, working status, social class, BMI, smoking
status, binge drinking, grams of alcohol consumed daily, conditioning physical activity, life satisfaction, sleep length, and use of hypnotics and/or
tranquilizers.

SLEEP, Vol. 30, No. 10, 2007
1250
mortality were increased both in men (1.56, nonsignificant) and in
women (2.82, significant). Additionally, sleeping fairly well and
frequent medication was associated with significantly increased
HR in men (2.03). In those sleeping fairly poorly/poorly there
were no significant increased in risk of mortality with any fre-
quency of medication use. Including snoring as a covariate did
not change results.
In Table 9, risk of mortality for natural and external causes of
death and stability of sleep length is assessed. In men, there was
a significant increase for stable short (1.34) and stable long (1.29)
sleep in natural deaths, while for external causes we saw a sig-
nificantly increased mortality in short sleep at the beginning of
follow-up (1.62-3.16). In women the results were less consistent,
but a significant increase was observed in risk of natural death in
those with sleep becoming short in 1981 (1.24-2.23). Including
snoring as a covariate did not change the results in women, but
in men slightly attenuated the HRs in external causes of death,
making the combinations “short-short” (from 1.62 to 1.54) and
“long-short” (from 3.16 to 2.90) nonsignificant. In natural deaths,
there were significant association in young men with short sleep
and in old men with long sleep as well as in old women with short
sleep and frequent use of hypnotics and/or tranquilizers (data not
shown). In deaths due to external causes, there were significant
associations in young men with short sleep, decreased sleep qual-
ity, and frequent use of medication; in middle-aged men with fre-
quent use of medication; in young women frequent use of medi-
cation; and in old women short sleep, long sleep, and frequent use
of medication (data not shown).
DISCUSSION
This is the first study to assess the stability (i.e., more than one
measurement done) of 3 aspects of sleep behavior in relation to
long-term mortality. Over a 6-year period, sleep length and sleep
Sleep and Mortality—Hublin et al
Table 6—Stability of Hypnotic and/or Tranquilizers Use Between 1975 and 1981 and Total Mortality in 1982-2003: Hazard Ratios (95% Confi-
dence Intervals) for Each Combination of Self-Reported Medication Use. Percentage of Subjects in Each Medication Use Category Combination
Given for Men and Women
Use* Percentage All-Cause Mortality 1982-2003
Age-adjusted Age-adjusted Fully-adjusted Fully-adjusted
1975 1981 Men Women (men) (women) model (men) model (women)
N = 8796 N = 9326 N = 8412 N = 8824
No No 87.6 81.8 1.00 (reference) 1.00 (reference) 1.00 (reference) 1.00 (reference)
Infrequent No 3.7 5.4 1.13 (0.89, 1.43) 1.19 (0.94, 1.52) 1.01 (0.79, 1.30) 1.10 (0.85, 1.41)
Frequent No 0.7 1.0 1.31 (0.82, 2.10) 1.36 (0.86, 2.15) 1.13 (0.70, 1.84) 1.35 (0.75, 2.43)
No Infrequent 3.3 5.1 1.21 (0.94, 1.56) 0.97 (0.75, 1.25) 1.04 (0.79, 1.37) 0.97 (0.73, 1.28)
Infrequent Infrequent 1.4 2.5 1.30 (0.92, 1.84) 0.98 (0.70, 1.37) 1.19 (0.85, 1.67) 1.06 (0.73, 1.53)
Frequent Infrequent 0.3 0.7 2.40 (1.46, 3.94) 1.37 (0.87, 2.17) 1.36 (0.81, 2.27) 1.45 (0.90, 2.33)
No Frequent 1.2 1.3 2.17 (1.52, 3.08) 2.24 (1.66, 3.03) 1.63 (1.14, 2.33) 1.90 (1.36, 2.65)
Infrequent Frequent 0.5 0.8 1.63 (0.92, 2.86) 1.47 (0.96, 2.25) 1.30 (0.70, 2.40) 1.19 (0.72, 1.96)
Frequent Frequent 1.3 1.5 2.10 (1.56, 2.83) 1.59 (1.18, 2.13) 1.28 (0.90, 1.83) 1.46 (1.05, 2.01)
*infrequent = 1-59 days per year; frequent = 60 or more days per year.
Covariates measured in 1981 (in addition to age) in fully-adjusted model: education, marital status, working status, social class, BMI, smoking
status, binge drinking, grams of alcohol consumed daily, conditioning physical activity, life satisfaction, sleep length, and sleep quality.
Table 7—Joint Effects of Sleep Length and Sleep Quality in 1981 on Total Mortality: Hazard Ratios (95% Confidence Intervals) for Mortality in 1982-
2003. Hazard Ratios with 95% Confidence Intervals Given. Percentage of Subjects in Each Sleep Behavior Combination Given for Men and Women
Percentage Fully-Adjusted Fully-Adjusted
Sleep Length* Sleep Quality: Sleeping Model Hazard Ratios Model Hazard Ratios
Men Women Men N = 9529 Women N = 10265
Short Well 5.0 3.7 1.32 (1.03, 1.68) 1.35 (1.02, 1.78)
Short Fairly well 6.3 5.6 1.45 (1.20, 1.76) 1.17 (0.94, 1.47)
Short Fairly poorly/Poorly 4.0 4.1 1.33 (1.05, 1.68) 1.08 (0.85, 1.36)
Average (reference) Well 30.8 27.1 1.00 1.00
Average Fairly well 34.8 33.7 1.09 (0.94, 1.26) 0.93 (0.79, 1.11)
Average Fairly poorly/Poorly 4.5 4.4 1.25 (0.99, 1.58) 0.97 (0.76, 1.25)
Long Well 7.5 10.4 1.42 (1.17, 1.73) 1.16 (0.93, 1.44)
Long Fairly well 6.3 10.0 1.26 (1.02, 1.56) 1.08 (0.88, 1.32)
Long Fairly poorly/Poorly 0.9 1.0 1.18 (0.80, 1.73) 1.39 (0.92, 2.09)
* short = < 7 hours, average = 7-8 hours, and long = > 8 hours.
Covariates measured in 1981 (in addition to age) in this fully-adjusted model: education, marital status, working status, social class, BMI, smoking
status, binge drinking, grams of alcohol consumed daily, conditioning physical activity, life satisfaction, and use of hypnotics and/or tranquilizers.

SLEEP, Vol. 30, No. 10, 2007
1251
quality changed in about one-third of the population; more than 80%
did not use hypnotics and/or tranquilizers. Generally, the associa-
tion with an increased risk of mortality was strongest in short sleep,
long sleep, and frequent use of medication. Compared to previous
reports, the present study has several strengths: the study sample
is representative of the general population with very high response
rates; 3 aspects of sleep behavior were assessed simultaneously;
they were measured twice; the follow-up is long; and the statistics
on deaths and causes of death are comprehensive and reliable.
Our results support a U-shaped association between sleep
length and all-cause mortality
2
– risk of death being the smallest in
average sleepers (7-8 hours). After adjustment for factors known
to be associated with mortality, a significant increase in risk of
mortality by 26% in men and by 21% in women was observed in
short sleepers (<7 hours) and in long sleepers (>8 hours) by 24%
and 17%, respectively. Among men, stable short and stable long
sleep was associated with a significantly increased risk of mortal-
ity, but this was not seen in women. A decrease of sleep length to
short increased mortality in both genders, as did lengthening of
sleep from average to long.
Sleep quality was only minimally associated with increased
mortality in the fully-adjusted models, indicating that it does not
independently affect the risk of mortality. We find this somewhat
unexpected, as it may be speculated that in sleep, the significance
of quality could equal quantity. There are problems with the ac-
curacy of self-reports of sleep length, and such reports may rep-
resent time spent in bed rather than actual physiological sleep.
It is well known in sleep medicine that subjects with insomnia
underestimate their sleeping times. It is also possible that much
of the extended time in bed reported by many long sleepers may
Sleep and Mortality—Hublin et al
Table 8—Joint Effects of Sleep Quality and Use of Hypnotics and/or Tranquilizers in 1981 on Total Mortality: Hazard Ratios (95% Confidence
Intervals) for Mortality in 1982-2003. Percentage of Subjects in Each Sleep Quality and Medication Use Category Combination Given for Men
and Women
Percentage Fully-adjusted Model Fully-adjusted Model
Sleep Quality: Use Of Hypnotics Hazard Ratios Hazard Ratios
Sleeping and/or Tranquilizers* Men Women Men N = 9529 Women N = 10265
Well No 43.2 40.8 1.00 (reference) 1.00 (reference)
Well Infrequent 0.8 1.8 1.13 (0.59, 2.16) 1.18 (0.76, 1.84)
Well Frequent 0.6 0.6 1.56 (0.93, 2.62) 2.82 (1.88, 4.24)
Fairly well No 43.4 42.5 1.08 (0.95, 1.23) 0.94 (0.80, 1.10)
Fairly well Infrequent 2.8 4.5 1.19 (0.90, 1.56) 0.86 (0.63, 1.19)
Fairly well Frequent 1.0 1.7 2.03 (1.46, 2.83) 1.14 (0.76, 1.70)
Fairly poorly/Poorly No 5.4 4.8 1.18 (0.94, 1.48) 0.93 (0.71, 1.23)
Fairly poorly/Poorly Infrequent 1.5 2.0 1.21 (0.85, 1.72) 1.00 (0.72, 1.40)
Fairly poorly/Poorly Frequent 1.3 1.4 1.12 (0.77, 1.64) 1.16 (0.84, 1.60)
*infrequent = 1-59 days per year; frequent = 60 or more days per year.
Covariates measured in 1981 (in addition to age) in this fully-adjusted model: education, marital status, working status, social class, BMI, smoking
status, binge drinking, grams of alcohol consumed daily, conditioning physical activity, life satisfaction, and sleep length.
Table 9—Stability of Sleep Length Between 1975 and 1981 in Relation to Risk of Death From Natural and External Causes of Death in 1982-2003.
Hazard Ratios with 95% Confidence Intervals Given
Sleep Length* Risk Of Mortality 1982-2003
Natural Causes Natural Causes External Causes External Causes
1975 1981 Of Death Of Death Of Death Of Death
Men N = 9529 Women N = 10265 Men N = 9529 Women N = 10265
Short Short 1.34 (1.11, 1.63) 1.07 (0.86, 1.33) 1.62 (1.01, 2.60) 1.39 (0.55, 3.50)
Average Short 1.10 (0.92, 1.31) 1.24 (1.03, 1.48) 1.86 (1.31, 2.65) 1.49 (0.71, 3.16)
Long Short 1.24 (0.48, 3.21) 2.23 (1.35, 3.68) 3.16 (1.10, 9.05) 1.60 (0.20, 12.8)
Short Average 1.24 (0.96, 1.59) 0.89 (0.69, 1.13) 1.08 (0.60, 1.93) 1.86 (0.75, 4.60)
Average Average 1.00 (reference) 1.00 (reference) 1.00 (reference) 1.00 (reference)
Long Average 0.96 (0.76, 1.22) 0.98 (0.77, 1.25) 0.67 (0.35, 1.26) 1.18 (0.45, 3.07)
Short Long 1.27 (0.63, 2.56) 1.01 (0.58, 1.78) 1.09 (0.14, 8.43) 6.30 (1.96, 20.3)
Average Long 1.16 (0.98, 1.37) 1.20 (1.02, 1.41) 1.43 (0.95, 2.15) 1.09 (0.50, 2.35)
Long Long 1.29 (1.03, 1.62) 1.08 (0.87, 1.34) 1.18 (0.64, 2.17) 1.55 (0.67, 3.57)
* short = < 7 hours, average = 7-8 hours, and long = > 8 hours.
Covariates measured in 1981 (in addition to age) in this fully-adjusted model: education, marital status, working status, social class, BMI, smoking
status, binge drinking, grams of alcohol consumed daily, conditioning physical activity, life satisfaction, sleep quality, and use of hypnotics and/or
tranquilizers.

SLEEP, Vol. 30, No. 10, 2007
1252
have been spent awake.
2,14
Subjective sleep quality is strongly as-
sociated to the amount of slow wave sleep
15
which is considered
together with REM sleep to be most important for the function
of sleep, although incompletely understood. It seems that sleep
quantity and quality are so closely interrelated that controlling for
sleep length when assessing quality neutralizes its significance.
In our results, the association between stability of use of hypnot-
ics and/or tranquilizers and mortality was modest, showing signif-
icantly increased risk only when non-users became frequent users.
Results in earlier studies have been contradictory, either showing
increased mortality in hypnotic use
4
or no increase.
6
However, the
increase in use of these medications may considerably attenuate
the effect seen in our study: In Finland from 1975 to 2005, use of
hypnotics has almost tripled (from 18.8 to 54.4 DDD/1000 per-
sons/day), and use of tranquilizers has almost doubled (from 17.6
to 31.2; statistics of National Agency for Medicines, Finland).
Since the mid 1970s practically all these medications have been
benzodiazepines or benzodiazepine-like compounds.
When we examined natural and external causes of death sepa-
rately, there were consistent and also statistically significant in-
crease in men in risk of death from natural causes both in stable
short and stable long sleepers, and in deaths due to external causes
in short-sleeping men. There were significant differences between
the age groups in associations of sleep variables with the 2 groups
of death causes, and the clearest was between frequent use of hyp-
notics and/or tranquilizers and deaths due to external causes. Our
results suggest a complex association between sleep and mortal-
ity, probably with various mechanisms in different age and cause-
of-death groups.
There are some contradictions in the results and the method-
ological heterogeneity among the more than 20 studies on sleep
length and mortality, interfering with the comparability of their
conclusions.
2
These include differences in population characteris-
tics (e.g., sex and age of the subjects), the size of the study popu-
lation (<2,000–1.1 million), length of follow-up (3–23 years) and
the number of covariates adjusted for (none to 32). Differences in
the formulation of the questions assessing sleep length and other
sleep related aspects may also have affected the results.
16
With
proper covariate control, the association for short sleep, in par-
ticular, has weakened and in many studies lost statistical signifi-
cance. It seems that much, but not all excess mortality among long
and short sleepers may be attributed to differences in lifestyle and
health/disease-related factors between the sleep length groups. In
some occasions, the representativeness of the study population
has been questioned. This is the case with the large American
studies by Kripke et al,
3,17
which have been considered to be from
“a convenience population,” friends and associates of volunteers
of the American Cancer Society who do not reflect the general
population of the United States. That sample has a lower mortal-
ity rate and may have other unknown differences.
18
It is also note-
worthy that in our sample, sleep length and sleep quality changed
in one-third of the subjects over a relatively short (6-year) period.
It is probable that this is not unique for our population but occurs
in other populations as well; this may include those from which
results on the association between sleep length and mortality have
been published. This may be one major reason to explain at least
partly the variable results of these studies, especially regarding
short sleep.
2
Despite the methodological differences the present
study is fairly consistent with the results of the previous reports.
The reasons for the association between sleep length and
mortality is not clear, and even the existence of the association
has been questioned, with the conclusion that previous studies
have not proven the association in the absence of other contrib-
uting factors.
18
As groups, short and long sleepers are obviously
heterogeneous; they include healthy subjects sleeping accord-
ing to their needs (natural short sleepers or natural long sleep-
ers) as well as subjects with health-associated factors that either
shorten or lengthen their sleep. Several possible mechanisms
to explain the association between sleep length and mortality
have been suggested.
2
First, depression has been associated with
mortality and changes in sleep length
19,20
and could thus account
for the relation. Our results do not support this conclusion, as
adjustment for life satisfaction, which strongly correlates with
depression,
12
was done. Secondly, sleep disordered breathing
has been suggested as an explanation of increased mortality in
long sleepers.
21
This explanation also seems improbable because
adjustment for BMI and inclusion of snoring as a covariate only
slightly attenuated the hazard ratios. Thirdly, the possible effect
of underlying undetected major disease affecting sleep at base-
line could cause confounding, and this has been taken into ac-
Table 10—Age and Sex Adjusted Risk of Total Mortality (Hazard Ratio and 95% Confidence Interval) in 1982-2003 by Age-Groups (Age at Entry to
the Follow-Up). All Three Variables Measured in 1981 and Mutually Adjusted in the Same Model
All 24-39 Years 40-54 Years 55 Years Or More
N = 21268 N = 11747 N = 5759 N = 3762
Sleep Length
short 1.27 (1.16-1.39) 1.84 (1.48-2.27) 1.28 (1.07-1.55) 1.15 (1.03-1.29)
average 1.00 (reference) 1.00 (reference) 1.00 (reference) 1.00 (reference)
long 1.27 (1.17-1.38) 1.40 (1.12-1.76) 1.15 (0.95-1.39) 1.25 (1.12-1.39)
Sleep Quality
sleeping well 1.00 (reference) 1.00 (reference) 1.00 (reference) 1.00 (reference)
sleeping fairly well 1.06 (0.98-1.14) 1.22 (1.02-1.46) 1.10 (0.95-1.28) 0.96 (0.87-1.07)
sleeping fairly poorly/poorly 1.17 (1.04-1.31) 2.00 (1.50-2.66) 1.22 (0.96-1.54) 1.05 (0.91-1.21)
Use Of Hypnotics And/Or
Tranquilizers
no 1.00 (reference) 1.00 (reference) 1.00 (reference) 1.00 (reference)
infrequent 1.07 (0.93-1.23) 1.58 (1.12-2.21) 1.33 (1.04-1.71) 0.88 (0.73-1.06)
frequent 1.70 (1.45-1.99) 2.72 (1.82-4.08) 2.01 (1.50-2.70) 1.49 (1.23-1.80)
* short = < 7 � .
Sleep and Mortality—Hublin et al
SLEEP, Vol. 30, No. 10, 2007
1253
count only in few previous studies.
22
However this explanation
does not seem plausible. In our study the possible confound-
ing by undetected major disease affecting sleep at baseline was
controlled for because subjects had to be alive at the end of the
6-year period (1975-81) between the 2 measurements of the 3
aspects of sleep behavior. Moreover, exclusion of deaths in the
first 3 years of the follow-up did not change our results. Other
possible explanations for the proposed association include a
large number of lifestyle and health-related factors potentially
associated with both sleep length and mortality, such as low so-
cioeconomic status.
23
In the present study, the adjustment for
various important covariates attenuated but did not fully explain
the association between sleep behavior and mortality. Moreover,
some residual confounding by measured or unmeasured factors
may still have been present. Our results suggest the possibility
of several mechanisms underlying the association between sleep
and mortality, probably being different in e.g., short and long
sleepers and in different causes of death.
In conclusion, there is an association between sleep behavior
(most notably in sleep length) and mortality. The exact mecha-
nisms remain unclear, and they should be assessed in experimental
settings and other longitudinal studies. Morbidity and functional
limitations as less severe outcomes should also be considered. Al-
though the effect of sleep on mortality is fairly modest compared
to e.g., smoking or components of the metabolic syndrome, it is
still of considerable significance as it is associated with several
common disorders such as cardiovascular diseases and diabetes.
Optimizing sleep—in addition to disorder-specific treatment—
could improve prognosis in these disorders. Our results add evi-
dence to the association between sleep and health outcomes.
ACKNOWLEDGMENTS
This work has been performed at the Department of Public
Health, University of Helsinki, Helsinki, Finland.
Financial support: Supported by the Academy of Finland Cen-
ter of Excellence in Complex Disease Genetics
Some of the results of this study were presented at the 17th
Congress of the European Sleep Research Society, Prague Octo-
ber 5-9, 2004, and the 1st Congress of World Association of Sleep
Medicine, Berlin, October 15-18, 2005.
REFERENCES
1. Hammond EC. Some preliminary findings on physical complaints
from a prospective study of 1,064,004 men and women. Am J Public
Health Nations Health 1964;54:11-23.
2. Youngstedt SD, Kripke DF. Long sleep and mortality: rationale for
sleep restriction. Sleep Med Rev 2004;8:159-74.
3. Kripke DF, Simons RN, Garfinkel L, Hammond EC. Short and long
sleep and sleeping pills. Is increased mortality associated? Arch Gen
Psychiatry 1979;36:103-16.
4. Kripke DF, Klauber MR, Wingard DL, Fell RL, Assmus JD, Garfin-
kel L. Mortality hazard associated with prescription hypnotics. Biol
Psychiatry 1998;43:687-93.
5. Walsh JK, Roehrs T, Roth T. Pharmacologic treatment of prima-
ry insomnia. In Kryger MH, Roth T, Dement WC, eds. Principles
and practice of sleep medicine. Elsevier Saunders, Philadelphia,
2005:749-60.
6. Rumble R, Morgan K. Hypnotics, sleep, and mortality in elderly
people. J Am Geriatr Soc 1992;40:787-91.
7. Kaprio J, Koskenvuo M. Genetic and environmental factors in
complex diseases: the Older Finnish Twin Cohort. Twin Res
2002;5:358-65.
8. Kaprio J, Koskenvuo M, Langinvainio H, Romanov K, Sar-
na S, Rose RJ. Genetic influences on use and abuse of alcohol: a
study of 5638 adult Finnish twin brothers. Alcohol Clin Exp Res
1987;11:349-56.
9. Romanov K, Rose RJ, Kaprio J, Koskenvuo M, Langinvainio H,
Sarna S. Self-reported alcohol use: a longitudinal study of 12,994
adults. Alcohol Alcohol 1987;S1:619-23.
10. Kujala UM, Kaprio J, Sarna S, Koskenvuo M. Relationship of lei-
sure-time physical activity and mortality. JAMA 1998;279:440-4.
11. Koivumaa-Honkanen H, Honkanen R, Antikainen R, et al. Self-re-
ported life satisfaction and recovery from depression in a 1-year
prospective study. Acta Psychiatr Scand 2001;103:38-44.
12. Koivumaa-Honkanen H, Kaprio J, Honkanen R, Viinamäki H, Ko-
skenvuo M. Life satisfaction and depression in a 15-year follow-up of
healthy adults. Soc Psychiatry Psychiatr Epidemiol 2004;39:994-9.
13. Williams RL. A note on robust variance estimation for cluster-cor-
related data. Biometrics 2000;56:645-6.
14. Lauderdale DS, Knutson KL, Yan LL, et al. Objectively measured
sleep characteristics among early-middle-aged adults: The CAR-
DIA study. Am J Epidemiol 2006;164:5-16.
15. Kecklund G, Akerstedt T. Objective components of individual dif-
ferences in subjective sleep quality. J Sleep Res 1997;4:217-20.
16. Allen RP. Article reviewed: Mortality associated with sleep dura-
tion and insomnia. Sleep Med 2002;3:373-5.
17. Kripke DF, Garfinkel L, Wingard DL, Klauber MR, Marler MR.
Mortality associated with sleep duration and insomnia. Arch Gen
Psychiatry 2002;59:131-6.
18. Foley DJ. An epidemiological perspective on one tale of a two-
tailed hypothesis. Sleep Med Rev 2004;8:155-7.
19. Perlis ML, Giles DE, Buysse DJ, et al. Self-reported sleep distur-
bance as a prodromal symptom in recurrent depression. J Affect
Disord 1997;42:209-12.
20. Patel SR, Malhotra A, Gottleib DJ, White DP, Hu FB. Correlates of
long sleep duration. Sleep 2006;29:881-9.
21. Bliwise DL, King AC, Harris RB. Habitual sleep durations and health
in a 50-65 year old population. J Clin Epidemiol 1994;47:35-41.
22. Tamakoshi A, Ohno Y. Self-reported sleep duration as a predictor
of all-cause mortality: Results from the JACC study, Japan. Sleep
2004;27:51-4.
23. Patel SR, Ayas NT, Malhotra MR, et al. A prospective study of sleep
duration and mortality risk in women. Sleep 2004;27:440-4.
Sleep and Mortality—Hublin et al
The study being referenced here assesses the relationship between mortality and benzodiazepine hypnotic (e.g. ProSom, Dalmane, Restoril, Halcion) use in **elderly people**. The survey size was of 1042 respondents aged over 65.
The Beck Depression Inventory, created by American psychiatrist Aaron Beck, is a 21-question multiple-choice self-report inventory, which is widely used psychometric tests for measuring the severity of depression.

To give you a sense, according to the *Center for Disease Control and Prevention*, overall mortality among smokers in the United States is about three times higher than that among similar people who have never smoked ([report](https://www.surgeongeneral.gov/library/reports/50-years-of-progress/exec-summary.pdf)).
In the United States, the usage of sleep aids has been rising for the past few decades. According to the CDC, about 4% of the U.S. adults aged 20 and over used **prescription** sleep aids in the past month. More adult women (5.0%) use prescription sleep aids than adult men (3.0%). The share of people using **over-the-counter sleep aids** regularly is significantly higher (estimated to be as high as 20%).

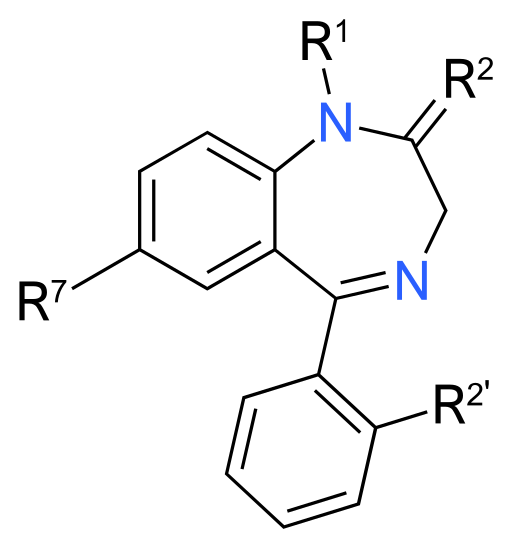
Benzodiazepines are a class of psychoactive drugs whose core chemical structure is the fusion of a benzene ring and a diazepine ring. **Valium** is an example of a Benzodiazepine drug.
Benzodiazepines are a central nervous system depressant. In other words, they slow brain activity by interacting with neurotransmitters, in this case GABA (gamma-aminobutyric acid) neurotransmitters.
Recently, Fitbit (a company that manufactures activity trackers) released a few interesting statistics that they got from analyzing over 6 billion nights of sleep. They found that on average women sleep 25 minutes longer a night than men. Women average six hours and 50 minutes of sleep a night, whereas men only get six hours and 26 minutes. 
**Slow-wave sleep** (SWS), also commonly referred to as deep sleep, consists of a stage of non-rapid eye movement sleep (non REM). This period of sleep is called slow-wave sleep because the Electroencephalographic activity is synchronized, producing "slow waves” with a frequency range of 0.5-2 Hz.
**Rapid eye movement sleep** (REM sleep), is a phase of sleep (unique to mammals and birds) that is characterized among other things by rapid random movements of the eyes and more vivid dreams.
The study being referenced is ["Some preliminary findings on physical complaints from a prospective study of 1,064,004 men and women”](https://www.ncbi.nlm.nih.gov/pmc/articles/PMC1254627/pdf/amjphnation00168-0013.pdf) and it was published in 1964. This study was mainly concerned with cancer but they did identify a pattern that pointed to a somewhat unexpected u-shaped curve in the association between average sleep time and mortality:
> Those who get less than five hours of sleep per night had
> very high death rates, and those who got ten or more hours
> of sleep per night had higher-than-average death rates.
In this study, Youngstedt and Kripke reference a data set of *1.1* million respondents and point out that even after controlling for 32 potentially confounding risk factors they still found a significant increase in mortality for people sleeping longer than *7.5*h on average. They claim that sleep restriction might resemble dietary restriction as a potential aid to survival and even that acute sleep restriction can have dramatic antidepressant effects.
### Primer on Hazard Ratios
**Hazard Ratios** are commonly used in *Time-to-event analysis*. As the name indicates, this type of analysis gives you an indication of how long it takes for a specific event (e.g. death, cancer relapse) to occur.
To understand Hazard Ratios we need to first understand what a *hazard* is. In this context, a hazard is the probability that an individual at time *t* has an event at that time (assuming event-free survival to time *t*).
Therefore, a Hazard Ratio is defined as:
$$ HR = \frac{Hazard\ in\ treatment\ group}{Hazard\ in\ control\ group} $$