## TL;DR
Mallon & Franks show that scouts of the rock-dwelling a...
The use of Leptothorax albipennis is due to their simple, flat nest...
An interesting related result is the **Crofton formula**, which als...
Here I implemented a visual simulation of Buffon’s needle problem t...
**Buffon's Needle** is one of the earliest problems in geometric pr...

Ants estimate area using Buffon’s needle
Eamonn B. Mallon
*
and Nigel R. Franks
Centre for Mathematical Biology, and Department of Biology and Biochemistry, University of Bath, Bath BA2 7AY, UK
We show for the ¢rst time, to our knowledge, that ants can measure the si ze of potential nest sites. Nest
size assessment is by individual scouts. Such scouts always make more than one v isit to a potential nest
before initiating an emigration of their nest mates and they deploy individual-speci¢c tra ils within the
potential new nest on their ¢rst visit. We test three alternative hypotheses for the way in which scouts
might measure nests. Experiments indicated t hat individual scouts use the intersection frequency betwe en
their own paths to assess nest areas. These results are consistent with ants using a `Bu¡on’s needle algo-
rithm’ to assess nest areas.
Keywords:
ants; colony emigration; individual-speci¢c pheromones;
Leptothorax
; nest sites;
rules of thumb
1. INTRODUCTION
Social insect colonies are groups of autonomous indivi-
duals which appear, on certain occasions, to reach such
complete accord that it has long become popular to see
the colony as analogous to a single organism or super-
organism (Wheeler 1928; Seeley 1989, 1995; Wilson &
Sober 1989; HÎlldobler & Wilson 1990). How the beha-
viour of individual workers translates into collective deci-
sions by the whole or large parts of a colony is now a
major area of interest in the study o f social insects (Franks
1989; Beckers
et al.
1993; Bourke & Franks 199 5; Seeley
1995; Bonabeau
et al.
1997; Detrain & Deneubourg 1997;
Pratt 1998; Detrain
et al.
1999). However, relatively little
work has been done on the information gathering which
provides the options for these decision-making processes
(but see Seeley 1977; Lums den & HÎlldobler 1983;
Beckers
et al.
1990, 1992; Franks
et al.
1991).
In this paper we are concerned wit h the a ssessment of
potential new nest sites by individual ant workers prior to
the emigration of their colony from an old nest to a new
nest site. Nest-site selection by honeybee scouts attempting
to ¢nd suitable hive sites for their swarming colonies has
been the subject of a number of classic studies (Lindauer
1955, 1961; Seeley 1977). However, we are unaware o f any
analogous work on nest-site assessment by members of ant
colonies.
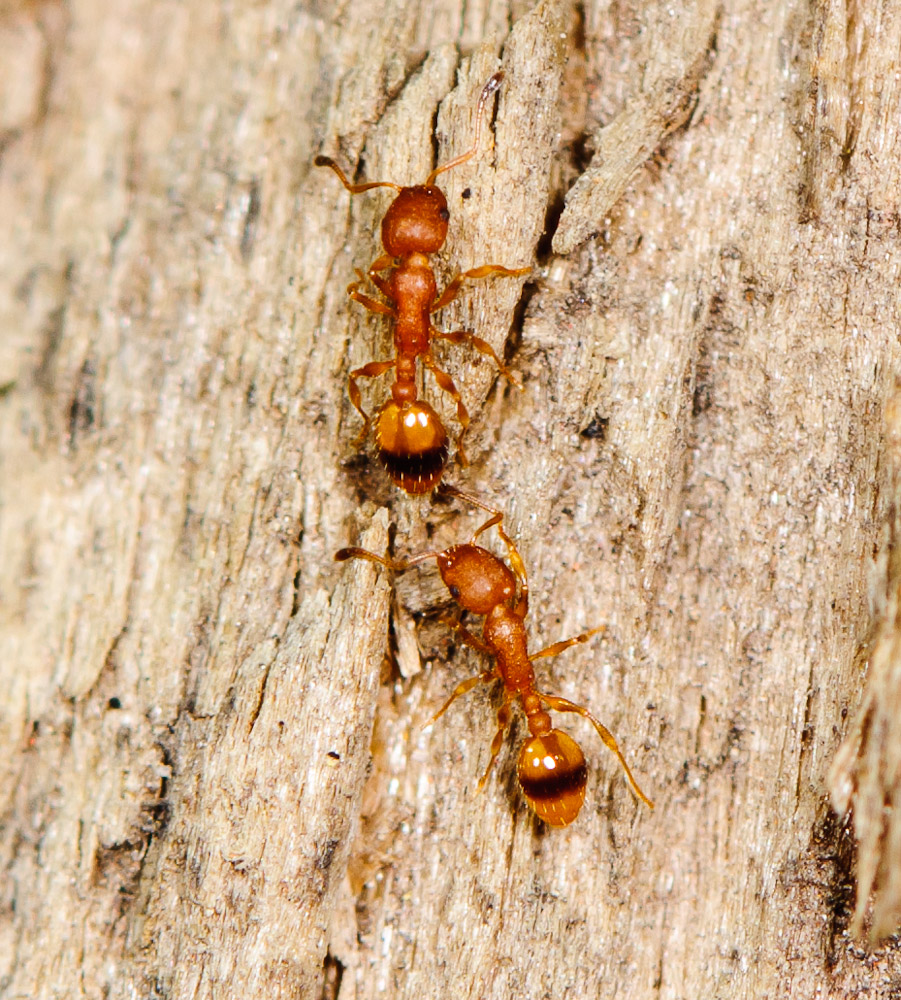
Leptothorax albipennis
ant colonies inhabit minute £at
crevices in rocks and scouts assess potential new nest sites
when their old nest is destroyed. The scale and geometry
of natu ral nest sites of
L. albipennis
can be closely approxi-
mated in the laboratory by nest sites made of microscope
slides (Franks
et al.
1992; Franks & Deneubourg 1997)
(¢gure 1). Such nests are £at and their £oor area is related
to the number of ants they can accommodate (Franks
et
al.
1992). We used such microscope slide nests with nest
cavities o f di¡erent sizes, shapes and con¢gurations in
order to examine preferences. Furthermore, because
scouts are visible at all times in such nests, the details of
their behaviour can be accurately recorded. The simpli-
city of these nests also means that nests ca n be relatively
easily manipulated during the assessment process a nd in
this way the rule of thumb which scouts use to measure
potential nest areas can be elucidated.
2. METHODS
Colonies of L. albipennis were collected from areas n ear the
Dorset coast (Partridge et al. 1997) and cultured in the labora-
tory using the methods described in Sendova-Franks & Franks
(1995a). In nest-choice e xperiments individual colonies within
their nests were transferred to a large (220 mm
£
220 mm),
square Petri dish, the sides of which were covered with Fluon
1
to prevent the ants escaping. New nests, of the types described
in ¢gure 1 and table 1, were positioned equidistantly (entrance to
entrance) from the old nest. An emigration was then initiated by
removing the uppermost glass slide from the old nest (Sendova-
Franks & Franks 1995b). The relative positions of the di¡erent
potential nests were randomized in the di¡erent replicates to
eliminate possible directional biases. A nest was considered
chosen when all of the adult ants (except a few foragers) and all
of the brood were present within a nest. Nest choices were,
therefore, unequivocal.
During experiments i n which the behaviour of individual
scouts was analysed, all of the workers in each colony were indi-
vidually and uniquely marked with paint (Sendova-Franks &
Franks 1993). The behaviour of scouts during visits to potential
new nest sites was videotaped. The path of individual ants was
digitized by viewing the videotapes on the V DU of a computer
equipped with suitable software.
3. RESULTS AND DISCUSSION
Given choices, colonies with a single queen, brood an d
50^100 wo rkers will emigrate into nests of a certain `stan-
dard size’ and will reliably reject nests both of half stan-
dard size and of ¢ve -eighths standard size (table 1,
experiments A and B). This shows that these ants can
measure areas. How do they do this ?
The assessment of new nest sites is by individual scouts
(see ¢gure 2). Experiments involving individually marked
workers showed that scouts will typically only initiate the
recruitment of nest-mates when they have made more
than one visit to a suitable nest site (13 out of 18 ants
made repeat visits b efore recruiting). The median time
that a scout spends within a nest cavity assessing a
Proc. R. Soc. Lond. B (200 0) 267, 765^770 765 © 2000 The Royal Society
Received 4 January 2000 Accepted 26 January 2000
*
Author for correspondence (bspem@bath.ac.uk).

potential nest is 110 s per visit (interquartile range 140 s
and
n
ˆ
115) (data pooled from visits by scouts to
standard-size nests du ring ¢ve separate experiments
involving ¢ve colonies).
We tested three alternative hypotheses about the
method which individual scouts use to assess nest area.
They may (i) measure the length of the internal peri-
meter of the nest as a loose correlate of nest area, (ii) use
a `mean, free-path-length algorithm’ or (iii) employ
`Bu¡on’s needle algorithm’.
The ants do not use the length of the internal perimeter
of the nest as a surrogate index of nest area. Given a
choice between a standard-size nest a nd a half-size nest
with the same internal perimeter leng th (¢gure 1
c
), the
ants choose the larger nest (table 1, experiment C). Scouts
spend a good proportion of their visits exploring the peri-
meter of a potential nest site (¢gure 2). This may re£ect a
need to check that the wall is not breached in too many
places and may help scouts return to the nest entrance.
A scout using the mean, free-path-length algorithm
would use the average distance it walks between collisions
with the walls in the new nest to estimate the area of the
nest. The greater the average distance the greater the nest
area. An experiment in which a thin partial barrier was
placed down the centre of an otherw ise standard-size nest
(¢gure 1
d
) showe d that the ants are not using this
method. The ants chose similar numbers of such partial
barrier nests in which their mean, free-path length would
be small- and standard-size nests (table 1, experiment D).
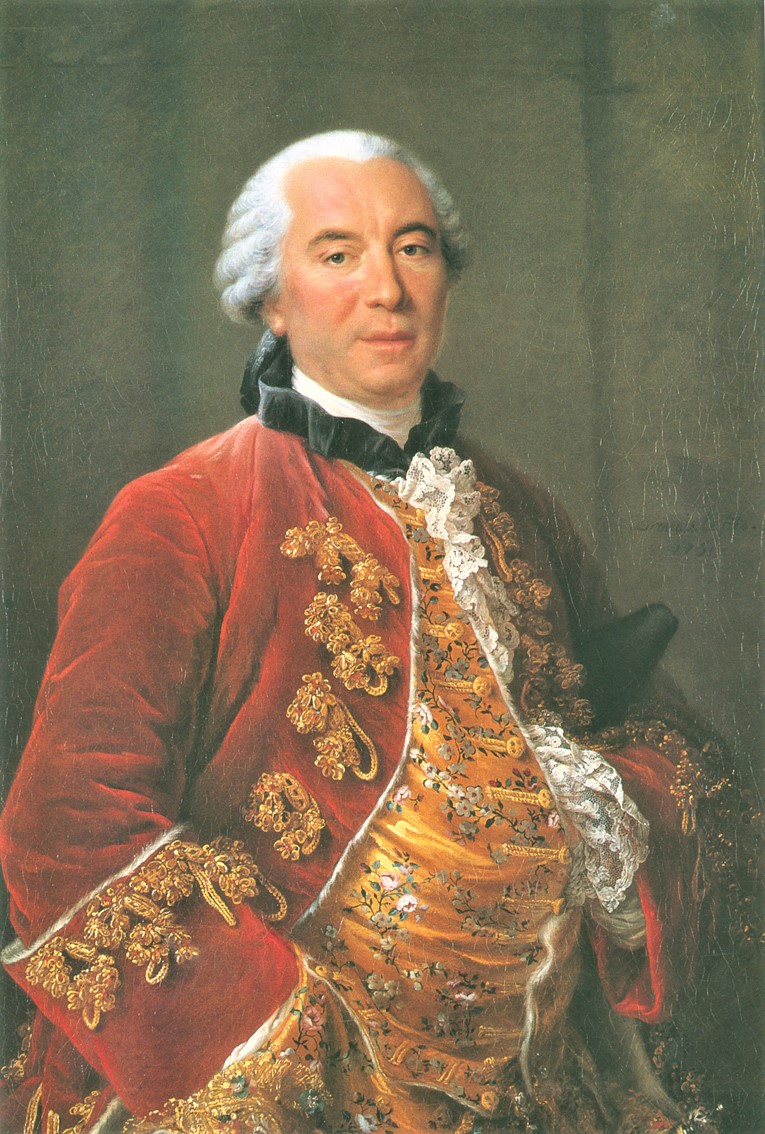
Two centuries ago, Comte George de Bu¡on proposed
a method for estimating º empirically. A needle of length
B
dropped randomly onto a plane inscribed with parallel
straight lines
I
units apart (where
B5I
) has a probability
p
ˆ
2
B
/
I
º of intersecting a line (Kendall & Moran 1963).
Based on such reasoning, it can be shown (Newman 1966;
Franks 1982) that the estimated area of a plane (
A
ª
) is
inversely proportional to the number of intersections (
N
)
between two sets of lines, of total lengths
S
and
L
,
randomly scattered on to it: thus
A
ª
ˆ
2
SL
/º
N
. This
formula establishes that the number of intersections
between two sets of lines could be used as a relatively
simple rule of thumb to estimate area.
Scouts using such a Bu¡on’s needle algorithm will
assess nest area as inversely proportional to the numb er of
intersections they ma ke between a ¢rst set of pheromone-
marked paths and a second set of census paths. Hence,
use o f the Bu¡on’s needle a lgorithm might explain why
scouts make more than one visit to a potential nest site.
The Bu¡on’s needle algorithm requires the deployment of
two distinct sets of paths. Conceivably, an ant could
remain within the new nest site between the deployment
of its ¢rst and second paths but some transitional break
between these activ ities is necessary. Departure from the
nest would not only provide such a break but may also
allow the ant to check the route between the old and the
new nest. Scout ants often return to the old nest between
766 E. B. Mallon and N. R. Franks
The ant and Bu¡on’s needle
Proc. R. Soc. Lond. B (2000)
(
a
) (
b
)
30 mm
(
c
)
(
d
) (
e
)
Figure 1. Nest designs: (a) standard-size nest, (b) half-size
nest, (c) half-size nest with same internal perimeter as a
standard-size nest, (d ) standard-size, partial barrier n est
ö
the
black line i s a cardboard wall from £oor to roof which could
be circumnavigated only at its ends, and (e) half-size, magic
carpet nestöthe shaded areas represent the holes in the upper
carpet (see the text). All the nests were constructed from
0.8 mm cardboard, from which rectangular cavities had been
cut, sandwiched between microscope slides.
Figure 2. The path of a single scout (thin black line) on each
of its three successive vis its to the same p otential nest site. The
ant appears to spend a considerable part of its visit near the
internal perimeter of the new nest. Nevertheless, in general,
the number of i ntersections between second and ¢rst visit
paths in the central region of the nest (within the inner box)
and the edge region of the nest (between the two boxes) is
similar (see the text). The ¢rst visit path in the central region
of the nest line is reasonably uniformly distributed. This
should ensure that the Bu¡on’s needle algorithm gives a
reasonably accurate estimation of the nest area.

visits to the new one (E. B. Mallon and N. R. Franks,
unpublished observations).
However, the Bu¡on’s needle algorithm c an only wo rk
if the ¢rst visit path was marked with an individual-
speci¢c trail pheromone which could be detected on the
second visit. The trail pheromones would need to be indi-
vidual speci¢c because several scouts can simultaneously
discover a potent ial nest site and if they deployed the
same trail pheromones in the new nest site the number of
second visit intersections would depend heavily not just
on the nest area but on the number of scouts involved.
Hence, private trail signals are required.
Closely related species of
Leptothorax
to
L. albipennis
are
known to use individual-speci¢c trail pheromones for
orientation outside their nests (Maschwitz
et al.
1986;
Aron
et al.
1988). We present here, to the authors’ knowl-
edge, the ¢rst evidence that
L. albipennis
ants deploy
individual-speci¢c trail pheromones within new nest sites.
Typically, scouts spend less time within the potential nest
cavity during subsequent visits (¢gure 3). Experiments in
which potential nest sites were substituted between a
scout’s ¢rst and subsequent visits showed that she only
reduced the length of her scouting p eriods if she had
herself made an earlier visit to the nest site. Visits by
other nest-mates or by conspeci¢c ants from other colo-
nies had no in£uence. We recorded the duration of visits
by ind ividually marked workers to a standard-size nest
and to a substitute nest of the same size. After the ant left
the nest following its ¢rst visit, the nest was either
(i) substituted by one visited by a worker from a di ¡erent
colony or (ii) substituted by one v isited by a nest-mate. In
(i) and (ii) the individual worker spent as long in the
replacement nest as expected on a ¢rst visit (Wilcoxon
signed-ranks test for paired comparisons, (i)
z
ˆ
7
1.224,
n
ˆ
14 and
p
ˆ
0.221, and (ii)
z
ˆ
7
0.336,
n
ˆ
16 and
p
ˆ
0.737). These experiments indicated that scouts deploy
individual-speci¢c trail pheromones during their ¢rst
visit to a nest site and that they respond to these on their
second v isit. This is the ¢rst time individual-speci¢c trail
pheromones have been shown to be used inside nest
cavities.
There is evidence that individual scouts recognize and
respond to intersections between their seco nd visit path
and their ¢rst visit path. Scouts brie£y but signi¢cantly
slowed down during their second visit when they inter-
sected their ¢rst visit path. Videotape images of the beha-
viour of ants on their ¢rst and second visits were d igitized
and analysed and the locations of the intersections
between second visit and ¢rst visit paths were re corded.
The speeds of the ants during second visits were calcu-
lated every 0.2 s. The speeds at intersections were noted
when an ant was with in one antenna’s length (
ˆ
5 pixels)
of its ¢rst visit path. Ants may also move at di¡erent
speeds in the centre of the nest or close to a wall. Hence,
we analysed the ants’ intersection and non-intersection
speeds in two regions: (i) central (any point greater than
30 pixels, i.e. slight ly g reater than one body length, from
a wall), and (ii) edge (points less than 30 pixels from a
wall). Nine ants were examined; of these six showed
signi¢cant changes of speed at intersections a nd all six
slowed down (me dian non-intersection speed in the
central region 5.80 mm s
¡
1
and interquartile range
10.44 mm s
¡
1
, median intersection speed in the central
region 3.79 mm s
¡
1
and interquartile range 9.52 mm s
¡
1
,
median non-intersection speed in the edge region
4.53 mm s
¡
1
and interquartile range 7.97 mm s
¡
1
, and
median intersection speed in the edge region 3.04 mm s
¡
1
and interquartile range 6.02 mm s
¡
1
). These data were
analysed using a two-way ANOVA design for ranks by the
Scheirer
^
Ray
^
Hare extension of the Kruskal
^
Wallis test
(
H
range 5.1^29.9, d.f.
ˆ
1 and
p
range
5
0.05^
5
0.001)
(Sokal & Rohlf 1995).
The ant and Bu¡on’s needle
E. B. Mallon and N. R. Franks 767
Proc. R. Soc. Lond. B (200 0)
Table 1.
Nest-choice experiments
(The table records the number of colonies which chose each type of nest. In experiment A c hoices of standard-size and two times
standard-size nests were pooled because we were concerned with the rejection of half-size nests. The frequencies were analysed
with either one-tailed (indicated by an asterisk) or two-tailed (indicated b y a double asterisk) binomial tests. n.s., not
signi¢cant.)
experiment nest choice p
A twice standard s ize standard size half size
chosen 7 8 1 ö
above threshold size below threshold size
chosen 15 1
5
0.0010
**
B standard size ¢ve-eighths st andard size
chosen 15 0
5
0.0001
**
C standard size half size with standard-size
internal perimeter
chosen 10 3
5
0.0500
*
D standard size standard size with partial
barrier
chosen 6 9
4
0.3000
*n.s.
E standard size magic carpet half size
chosen 12 8
4
0.8000
*n.s.

Bu¡on’s needle algorithm requires that the trail phero-
mone is relatively long lived. Individual-speci¢c trail
pheromones are likely to be more persistent than mass
recruitment phero mones which can be reinforced quickly
by nest-mates. For example, individual-speci¢c phe ro-
mones deployed during foraging must last long enough
for an individual ant to get to the end of its journey and
for it to be able to retrace its steps. For
L. albipennis
, we
believe that their foraging distances are likely to exceed
their emigration distances. Therefore, individual-speci¢c
pheromones which are su¤ciently long lived for foraging
should be su¤ciently long lived for nest assessment.
Highly persistent ground-marking pheromones have been
demonstrated in other contexts (HÎlldobler & Wilson
1977, 1986). In fact, the median intervisit duration is only
145 s (interquartile range of 461s,
n
ˆ
89).
On their second visit, scouts could be assessing the
frequency of the intersections they make with their own
individual-speci¢c trail which they deployed on their ¢rst
visit. The median number of intersections per scout
between second visit paths and ¢rst visit paths in the
central and edge regions of the nest were 178 and 172,
respectively (
n
ˆ
11 scouts). First visit and subsequent visit
paths appear to sample the whole a rea of the nest fairly
evenly (¢gure 2). Figure 4 shows the relationship between
the length of an ant’s second visit and the number of
intersections it makes during that visit with its ¢rst visit
path. The relationship i s strong and linear. This suggests
that the paths are distributed to facilitate unbiased
surveying. In other words, the distribution of the ¢rst set
of lines (
L
) and the second set of lines (
S
) is a su¤cient
approximation to randomness. The median distances
scouts walk on ¢rst, second an d third visits are 726, 498
and 404 mm, respectively (
n
ˆ
11 scouts). For many ants
(31%) two visits appears to be not only a necessary condi-
tion but also a su¤cient condition for estimation of a
nest’s area. For this reason and to simplify the analysis,
we focused on the behaviour of ants on their second visit
compared to their ¢rst visit. Scouts may only deploy
individual-speci¢c trails on their ¢rst visit: all subsequent
visits might be f or a ssessment. For example, during their
third visit, ¢ve out of 11 a nts slowed down when crossing
the trail they had personally deployed on their ¢rst visit
(
H
range 9.68^17.44, d.f.
ˆ
1 and
p
range
5
0.01^
5
0.001).
The average speed of scouts overall is markedly less on
the ¢rst visit (median 3.36 mm s
^1
, interquartile range
6.33 mm s
^1
and
n
ˆ
8681) than during subsequent visits
(median 4.06 mm s
^1
, interquartile range 6.93 mm s
^1
and
n
ˆ
9834 for second and third v isits combined: Mann^
Whitney
U
-test,
p5
0.0001) (the data for the second and
third visits were combined because they were not signi¢-
cantly di¡erent from one another,
p4
0.05). This may be
indicative of trail laying only on the ¢rst visit. If ants laid
trails on more than one visit, the complexity of estimating
a nest’s area from the intersection rate would be greatly
increased. Multiple visits may increase the accuracy of
nest-area assessment through repeated measurement of
the intersection frequencies.
The Bu¡on’s needle equation for estimating area is
A
ª
ˆ
2
SL
/º
N
. Hence, an ant might estimate area
A
ª
as
inversely proportional to the number of intersections (
N
)
it ma kes between its ¢rst visit path (length
L
) and its
768 E. B. Mallon and N. R. Franks
The ant and Bu¡on’s needle
Proc. R. Soc. Lond. B (2000)
10
(
a
)
(
b
)
8
6
4
2
0
8
6
4
2
0
(
c
)
8
6
4
2
0
first second
longest
intermediate
shortest
visit order
frequency
third
Figure 3. (a) The duration of assessment visits by individually
marked workers to standard-size nests were recorded for their
¢rst, second and third visits to the same nest. The visits of
individuals were ranked: longest (black bars), intermediate
(shaded bars) and shortest (white bars) in duration. Visits
became progressively shorter (Friedman’s t wo-way analysis of
ranks
w
2
r
2
ˆ
6:14 and p
5
0.05). (b) If the nest was replaced by
an identical ne w clean nest after e ach visit the ant spent the
same amount of time on each visit (
w
2
r
2
ˆ
0:3 and n.s.). (c) As
a control for physical disturbance in the nest-substitution
experiments, the original nest was moved and then placed
back in position. Here, as in ¢ gure 2a, the ants spent less time
on each subsequent visit (
w
2
r
2
ˆ
6:00 and p
5
0.05).
0 100
no. of path intersections
600
500
400
300
200
100
0
200
second visit duration (s)
300 400
Figure 4. The number of intersections be tween second visit
paths and ¢rst visit paths as a function of the duration of the
second visit by 11 scouts to nests of standard size. The
relationship is best described by number of intersections
(N )
ˆ
7.4 + 1.23. (Second visit duration, in seconds).
(r
2
ˆ
0.873 and p
5
0.001.)

second visit path (length
S
): 2 and º are constants and
irrelevant here. This rule of thumb would be simplest if
the ants keep
L
constant and estimate the intersection
rate between their ¢rst and second paths. The duration
and path length of the second visit could var y. This would
in£uence the variance of the estimate, but not the mean
intersection rate (see ¢gure 4). The duration of ¢rst visits
has a distinct peak at 200 s (see ¢gure 5). Intriguingly,
the duration o f second visits also has a distinct peak at
200 s. This suggests that the ants are keeping both
L
and
S
fairly constant. Furthermore, in the clean nest-
substitution experiment, each ant repeatedly spent
approximately the same amount of time in each new nest
it was o ¡ered. Thi s explains the pattern o f data presented
in ¢gure 3
b
.
All the ¢ndings documented above show that use of a
Bu¡on’s needle algorithm is plausible in terms of the
behaviour of scouts. However, the key test is to manipu-
late the ants’ trail intersection frequencies in such a way
that t he use of a Bu¡on’s needle algorithm would lead
them to make predictable but otherwise unexpected
choices. These ants are using individual-speci¢c trails so
it is not possible for the experimenter to apply the trail
pheromone directly to increase the trail intersection
frequencies. However, it is possible to reduce the number
of intersections. In the Bu¡on’s needle algorithm the
intersection frequency is inversely proportional to area.
We presented em igrating colonies with a choice between
standard-size nests and half-size nests. Both types of nest
were carpeted with two layers of acetate sheet. The upper
sheet in the half-size nest had rectangular holes in it over
half the total £oor area (¢gure 1
e
). Fifteen minutes after
the start of ea ch experiment, i.e. after half the median
exploratory period, this upper sheet in the half-size nests
was removed. By removing the `magic carpet’ at this
time, approximately half of the trails laid in the small
(half-size) nest should have been removed and the
number of intersections between ¢rst visit and subsequent
paths should have been similarly reduced. (As a control
for disturbance the under-sheet in the full-size nest was
removed at the same time.) In these exper iments,
approximately half of the colonies chose the small nest,
which would normally be rejected (table 1, experiment D).
Given that the intersection frequency in the small nest
was reduced by half , an ant using the Bu¡on’s needle
algorithm would then consider such a half-size nest to be
full size. This result strongly suggests that scouts are using
the Bu¡on’s needle algorithm. We suggest that scouts may
use the Bu¡on’s needle algorithm by assessing the rate at
which they cross th eir previous path. Such assessment is
plausible since optimal foraging studies show that many
insects can measure the rate at which they encounter
stimuli (Stephens & Krebs 1986). Figure 4 strongly
implies that the intersection rate between ¢rst and second
visit paths is very nearly consta nt for these ants. The
inverse of such an intersectio n rate should therefore
provide a good estimate of nest area. The extremely high
resolution in the choices between nests of di¡erent areas
(table 1) may result not just from the behaviour of indivi-
dual ants but also from many scouts being involved in
independent decision-making processes. This `voting’
phenomenon is current ly under investigation.
The employment of Bu¡on’s needle algorithm by these
ants is likely to be robust for two major reasons. First, it
should b e relatively insensit ive to the shape of the area to be
assessed a nd to the exact deployment of the census lines (as
long as these lines are not co ncentrated within just one
region). This is shown by the successful use of the Bu¡on’s
needle formu la in estimating the length of plant roots
(Newman 1966) and censusing animal populations (Franks
1982). Second, it can operate in an entirely dark nest.
Recent studies have revealed t he sophisticated naviga-
tion and landmark recognition skills of individual ants
and bees (Collett & Baron 1994; Wehner
et al.
1996; Judd
& Co llett 1998). Our ¢ndings, that individual ants can
make accurate assessments of nest areas based on a rule
of thumb, show in a unique way how animals use robust
algorithms to make well-informed quantitative decisions.
Honeybee scouts are known to measure the size of poten-
tial nest cavities before advertising the value of a nest site
to their swarm (Seeley 1977). The algorithm that honey-
bees use for such an assessment is not known, although
they do spend much time walking the inside walls of nest
cavities (Seeley 1977). Our work on ants opens up the
possibility that honeybee scouts may also be using rules of
thumb based in pa rt on the Bu¡on’s needle algorithm.
We wish to thank Tom Seeley, Tom Collett, Laurence Hurst,
Lucy Bellini, Rachel Fancy, Ana Sendova-Franks, Nick Britton,
Stephen Pratt, Stuart Reynolds, Mike Mogie, Andrew Spencer
and Sarah Backen and three anonymous referees for their help
with or discussion of this research. E.M. is supported by a
Natural Sciences Demonstratorship from the University of Bath.
REFERENCES
Aron, S., Deneubourg, J. L. & Pasteels, J. M. 1988 Visual cues
and trail following idi osyncrasy in Leptothorax unifasciatus: an
orientation process during foraging. Insect. Soc. 35, 355^366.
Beckers, R., Deneubourg, J. L., Goss, S. & Pasteels, J. M. 1990
Collective decision making through food recruitment. Insect.
Soc. 37, 258^267.
Beckers, R., Deneubourg, J. L. & Goss, S. 1992 Trails and U-
turns in the selection of a path by the ant Lasius niger. J. T heor.
Biol. 159, 397^415.
The ant and Bu¡on’s needle
E. B. Mallon and N. R. Franks 769
Proc. R. Soc. Lond. B (200 0)
6
5
3
2
1
0
1
2
3
4
4
5
1000800600400
visit duration (s)
frequency
first visit
2000
second visit
Figure 5. Histogram of the ¢rst (white) a nd second (shaded)
visit durations ( s) of 11 scouts to nests o f standard size.

Beckers, R., Deneubourg, J. L. & Goss, S. 1993 Modulation of
trail laying in the ant Lasius niger (Hymenoptera, Formicidae)
and its role in the collective selection of a food source. J. Insect
Behav. 6, 751^759.
Bonabeau, E., Theraulaz, G., Deneubourg, J.-L., Ar on, S. &
Camazine, S. 1997 Self-organization in social insects. Trends
Ecol. Evol. 12, 188^193.
Bourke, A. F. G. & Franks, N. R. 1995 Social evolution in ants.
Monographs in behavioral ecology. Princeton University Press.
Collett, T. S. & Baron, J. 1994 Biological compasses and the
coordinate frame of landmark memories in honeybees. Nature
368, 137^140.
Detrain, C. & Deneubourg, J. L. 1997 Scavenging by Pheidole
pallidula: a key for understanding decision-making systems in
ants. Anim. Behav. 53, 537^547.
Detrain, C., Deneubourg, J. L. & Pasteels, J. M. (ed.) 1999
Information processing in social insects. Basel, Boston and Berlin:
Birkhauser.
Franks, N. R. 1982 A new method for censusing animal p opula-
tions: the number of Eciton burchelli army ant colonies on
Barro Colorado Island, Panama. Oecologia 52, 266^268.
Franks, N. R. 1989 Army ants
ö
a collective intelligence. Am.
Sci. 77, 138^145.
Franks, N. R. & Deneubourg, J. L. 1997 Self-organizing nest
construction in ants: individual worker behaviour and the
nest’s dynamics. Anim. Behav. 54, 779^796.
Franks, N. R., Gomez, N., Goss, S. & Deneubourg, J. L. 1991
The blind leading the blind in army ant raid patterns: testing
a model o f self-organization (Hymenoptera: Formicidae). J.
Insect Behav. 4, 583^607.
Franks, N. R., Wilby, A., Silverman, B. W. & Tofts, C. 1992 Self-
organizing nest construction in ants
ö
sophisticated building
by blind bulldozing. Anim. Behav. 44, 357^375.
HÎlldobler, B. & Wilson, E. O. 1977 Colony-speci¢c territorial
pheromone in the African weaver ant Oecophylla longinoda
(Latreille). Proc. Natl Acad. Sci. USA 74, 2072^2075.
HÎlldobler, B. & Wilson, E. O. 1986 Nest area e xploration and
recognition in leafcutter ants (Atta cephalotes). J. Insect Physiol.
32, 143^150.
HÎlldobler, B. & Wilson, E. O. 1990 The a nts. Cambridge, MA:
Belknap Press of Harvard University Press.
Judd, S. P. D. & Collett, T. S. 1998 Multiple stored views and
landmark guidance in ants. Nature 392, 710^714.
Kendall, M. G. & Moran, P. A. P. 1963 Geometrical probability.
London: Charle s Gri¤n & Co. Ltd.
Lindauer, M. 1955 Schwarmbienen auf Wohnungssuche. Z. Verl.
Physiol. 37, 263^324.
Lindauer, M. 1961 Communication among social bees. Cambridge,
MA: Harvard University Press.
Lumsden, C. J. & HÎlldobler, B. 1983 Ritualized combat and
intercolony communication in ants. J.Theor. Biol. 100, 81^98.
Maschwitz, U., Lenz, S. & Buschinger, A. 1986 Individual
speci¢c trails in the ant Leptothorax a¤nis (Formicidae:
Mymicinae). Experientia 42, 1173^1174.
Newman, E. I. 1966 A method of estimating the total length of
root in a sample. J. Appl. Ecol. 3, 139^145.
Partridge, L. W., Partridge, K. & Franks, N. R. 1997 Field
survey of a monogynous leptothoracine ant (Hymenoptera:
Formicidae): evidence of seasonal polydomy? Insect. Soc. 44,
75^83.
Pratt, S. C. 1998 Condition-dependent timing of comb construc-
tion by honeybee colonies: how do workers know when to
start building? Anim. Behav. 56, 603^610.
Seeley, T. D. 1977 Measurement of nest cavity volume by t he
honey bee (Apis mellifera). Behav. Ecol. Sociobiol. 2, 201^227.
Seeley, T. D. 1982 How honeybees ¢nd a home. Sci. Am. 247,
158^168.
Seeley, T. D. 1989 The honey bee colony as a superorganism.
Am. Sci. 77, 546^553.
Seeley, T. D. 1995 The wisdom of the hive: the social physiology of
honey bee colonies. Cambridge, MA: Harvard University Press.
Sendova-Franks, A. F. & Franks, N. R. 1993 Task allocation in
ant colonies within variable environments (a study of
temporal polyethism: experimental). Bull. Math. Biol. 55,
75^96.
Sendova-Franks, A. B. & Franks, N. R. 1995a Demonstrating
new social interactions in ant colonies through r andomiza-
tion tests: separating seeing from believing. Anim. Behav. 50,
1683^1696.
Sendova-Franks, A. B. & Franks, N. R. 1995b Div ision-of-labor
in a crisis
ö
task al location during colony emigration in the
ant Leptothorax unifasciatus (Latr). Behav. Ecol. Sociobiol. 36,
269^282.
Sokal, R. R. & Rohlf, F. J. 1995 Biometry. New York: W. H.
Freeman & Co.
Stephens, D. W. & Krebs, J. R. 1986 Foraging theory. Princeton
University Press.
Wehner, R., Michel, B. & Antonsen, P. 1996 Visual navigation
in insects
ö
coupling of egocentric and geocentric informa-
tion. J. Exp. Biol. 199, 129^140.
Wheeler, W. M. 1928 The social insects: their origin and evolution.
New York: Harcourt, Brace & Co.
Wilson, D. S. & Sober, E. 1989 Reviving the superorganism. J.
Theor. Biol. 136, 337^356.
770 E. B. Mallon and N. R. Franks
The ant and Bu¡on’s needle
Proc. R. Soc. Lond. B (2000)
The use of Leptothorax albipennis is due to their simple, flat nest structures, which are easily replicated in lab settings with microscope slides.
This allows precise observation of scout behavior, unlike more complex nests of other ant species.
**Buffon's Needle** is one of the earliest problems in geometric probability, posed by French mathematician Georges-Louis Leclerc, Comte de Buffon in the 18th century.
#### The Problem:
Imagine dropping a needle of length `L` onto a floor with equally spaced parallel lines a distance `D` apart (where `L ≤ D`). What’s the probability that the needle crosses a line?
#### The Result:
Buffon showed that the probability `P` is: $ P = 2L/ πD$
This means you can **estimate the value of π** by performing the experiment many times and observing how often the needle crosses a line.
This problem reveals an interesting link between geometry, probability, and π. It’s considered the **first Monte Carlo method**, using randomness to solve a problem numerically.
## TL;DR
Mallon & Franks show that scouts of the rock-dwelling ant Leptothorax albipennis can judge whether a candidate cavity is big enough for the colony. Each scout makes two two-minute explorations: on the first it lays a pheromone trail; on the second it follows a fresh route that repeatedly crosses the first. The frequency of self-intersections is inversely proportional to floor-area, exactly as in Buffon’s-needle geometry, giving the ants a quick, shape-independent “rule-of-thumb” estimator of nest size.
An interesting related result is the **Crofton formula**, which also links **geometry and probability**.
It states that the **length of a curve** in the plane can be computed by integrating over all the lines that intersect it.
#### Basic Idea:
> The length of a curve = proportional to the **expected number of times** random lines intersect it.
For a smooth plane curve \( C \), the formula is:
$$
\text{Length of } C = \frac{1}{4} \int \int n(\theta, p)\, d\theta\, dp
$$
where \( n(\theta, p) \) is the number of intersections of the line (with angle \( \theta \) and distance \( p \) from the origin) with the curve.

Here I implemented a visual simulation of Buffon’s needle problem to calculate $\pi$ and to estimate the area of a surface (This was inspired Shi-yan's work)
**Simulation 1 - Estimating π with Buffon’s Needle**
Needles are randomly dropped on a canvas with evenly spaced horizontal lines (like floorboards). Each needle may or may not intersect a line. Red needles intersect; blue do not. The ratio of intersections is used to estimate π using the classic Buffon’s Needle formula. A real-time graph and pie chart visualize convergence toward π.
**Simulation 2 - Estimating Area with Long and Short Needles**
A set of long needles (lines) is scattered randomly across a 2D area. Short needles (dots) are then randomly dropped. Each short needle is checked for intersection with a nearby long one. Red dots intersect; blue do not. Using the number of intersections and known needle lengths, the simulation estimates the area of the region, updating the estimate dynamically.
You can play around with the simulations here: https://claude.ai/public/artifacts/de86a21c-6c5b-45bd-9ef9-cf0c9e088aef
