A good example of this behavior can be seen in the number of paper ...
Recent research has shown that a hyperbolic function provides a mor...
The core of the behavioral decision-making approach to time managem...

FEBRUARY 2016
|
PHYSICS TODAY 11
clearly shows the conducting properties
of a semiconductor at various condi-
tions. By the last lecture in that section,
the students understand the principle.
Using new technologies. With the
ever-increasing availability of online edu-
cation resources, including open course -
ware, online courses, and discussion fo-
rums, choosing the best resources is
becoming a new challenge for instructors.
However, electronic resources provide
new tools and opportunities to increase
students’ conceptual understanding.
I have adopted a lot of electronic re-
sources in teaching both Thermal Phys -
ics and Electromagnetism. For example,
Bose–Einstein condensation and super-
fluidity are subtle processes that can be
hard to understand, and few laboratory
teams have achieved those results exper-
imentally. Videos played in the class-
room allow students to watch the phase
transition when liquid helium-4 is
cooled to a temperature of 2.17 K and be-
comes a superfluid.
References
1. J. B. Biggs, Student Approaches to Learning
and Studying, Australian Council for Edu-
cational Research (1987).
2. K. Aikawa et al., Science 345, 1484 (2014).
3. E. B. Li et al., Nat. Commun. 5, 3225 (2014).
Enbang Li
(enbang@uow.edu.au)
University of Wollongong
Wollongong, Australia
A universal law of procrastination
T
hroughout our lives we all are under
pressure to deliver on deadlines. Yet
we often have a substantial time
window in which to complete the given
tasks—for example, term papers, book
chapters, tax returns. When during such
a window do we deliver? And to what
extent do we procrastinate?
Increasing pressure forces us to final-
ize tasks. The closer we are to the dead-
line, the higher the pressure. To quantify
things a bit, we could assume that dead-
line pressure is inversely proportional to
remaining time. Such scaling behavior is
well known in physics; for example, it
describes how the electrostatic potential
energy of a point charge depends on dis-
tance from the charge, or how the gravi-
tational potential energy of a system of
masses scales with distance between the
masses.
The scales look like 1/r, where r can
be distance, remaining time, or some
other factor. The corresponding mathe-
matical function is a hyperbola. To give
an example of the scaling using arbitrary
and dimensionless units, if a deadline is
100 days away, the pressure to meet it is
just 0.01. But if the deadline is tomorrow,
the pressure shoots up to 1.
As it turns out, that scaling may be
universal when it comes to human be-
havior and perhaps reflects a universal
law of procrastination (ULP). Cornelius
König and Martin Kleinmann reported a
hyperbolic “deadline rush” for a small
set of fewer than 30 students prepar-
ing for exams over a 21-day period.
1
As a program director at NSF, I was
impressed by the tremendous increase in
the number of proposals routinely sub-
mi"ed right before deadline as com-
pared with those turned in earlier in the
submission window. In analyzing large
data sets from 10 annual submission
M
0
Nt M D t C M D C()= /( − + )− /( + )
0
D
SUBMITTED PROPOSALS
TIME
PROPOSED MODIFIED HYPERBOLIC
function reflecting a universal law of
p r o c r a s t i n a t i o n . T h e r e d l i n e r e p r e s e n t s
the full form of the law, which illustrates
the hyperbolic scaling, N(t) is the number
of submissions received by day t, M is
the final number of proposals submitted,
and D is the number of days in the
submission window. According to the
universal law of procrastination,
N(t) = M/(D – t + C) − M/(D + C), where
C = ½ (√D · √4 + D – D) helps improve
the fit for small values of t. The second term
in the right-hand side of the equation
e n s u r e s t h a t N(t) = 0 at t = 0. Asymptote
(not shown) is located at t = D + C.

12 PHYSICS TODAY
|
FEBRUARY 2016
READERS’ FORUM
windows of greater than 60 days with
submissions from more than 1000 pro-
posers annually, I have found that the
data adhere to a modified hyperbolic
function, as plo"ed in the figure. The
model is simple, which means it omits
factors such as delays introduced by the
universities’ sponsored research offices.
Nevertheless, the procrastination behav-
ior is predicted quite well, and without
any fi"ing parameters.
As is shown in the figure, the ULP
curve provides a simple means of pre-
dicting the impact of proposal pressure
and of estimating the number of propos-
als expected as a function of remaining
time to deadline. Practical concerns for a
receiving institution include how to han-
dle the number of proposals received on
the deadline date and whether that load
will overtax or crash the existing com-
puter infrastructure.
Bear in mind, though, that hyperbolic
functions diverge to infinity at the as-
ymptote. To procrastinating submi"ers,
the most critical issue is that by waiting
until the deadline or close to it, they elim-
inate the time needed for identifying and
correcting errors that could make their
proposal ineligible for consideration.
I appreciate helpful discussions with Andy
Lovinger at NSF and the encouragement of
Cornelius König of Saarland University. Any
opinions expressed in this material are mine
and do not necessarily reflect the views of NSF.
Reference
1. C. J. König, M. Kleinmann, J. Psychol. 139,
33 (2005).
Tomasz Durakiewicz
(tomasz@lanl.gov)
National Science Foundation
Arlington, Virginia
Pictures of
climate change
S
pencer Weart’s article on climate im-
pacts (P
HYSICS TODAY, September
2015, page 46) describes the sociology
of how opinion has evolved on anthro-
pogenic change, but it says li"le about
the opinion’s scientific content. It is re-
markable that the scientific giant in this
field, Svante Arrhenius (1859–1927),
without knowledge of the Planck func-
tion—much less the quantum mechanics
of molecular opacity or computer
codes—made predictions of climate sen-
sitivity that are within a factor of two or
three of modern estimates. Was that a
lucky guess, or is the phenomenon so ro-
bust that even the crudest estimates are
almost as good as the most sophisticated?
Weart describes, but does not explain,
how the consensus about the effects of
climate change has shi(ed from equa-
nimity to fear and trembling that a great
disaster will ensue. Is climate change a
phenomenon to be observed, like the
weather? Is it of direct concern mostly to
farmers? Or is it a problem to be solved,
and if so, how urgently? The shi( is a so-
ciological phenomenon that calls for ex-
planation, but not by physicists.
The physical principles have long
been known, and François Massonnet’s
Commentary in the same issue (page 8)
explains that even our present under-
standing and computational capabilities
are not sufficient to predict regional ef-
fects such as droughts and floods. The
fact that multiphysics codes—which
combine multiple models to simulate
complex phenomena—could not predict
the failure of National Ignition Facility
targets should make us skeptical of their
power to predict any complex phenom-
enon, and climate is more complicated
than a laser target.
Jonathan Katz
(katz@wuphys.wustl.edu)
Washington University in St. Louis
St. Louis, Missouri
!!!
H
aving formerly worked for the Na-
tional Weather Service for 40 years,
including assignments at the Na-
tional Severe Storms Forecast Center and
various field forecast offices, I was struck
by the images in Spencer Weart’s article
“Climate change impacts: The growth of
understanding.” I thought it was inter-
esting that the editors chose to illustrate
the article with several weather-disaster
photos.
The cover photo shows flooding of
small fields lined with palms and other
tropical fauna. Other photos show
drought and floodwaters extending
halfway up storefront shops.
The inference, I suppose, is that climate
change caused those weather disasters,
despite the author’s stating he was unable
“to present a convincing case, based on
logic and observations, of why anyone
should believe the consensus state-
ments” about climate change impacts.
Those photographs perhaps make it
more pleasing visually to leaf through a
publication, but their inclusion only per-
petuates the myth that individual storms
are the result of climate change. For ex-
ample, the vast majority of the flooding
shown in the Hurricane Sandy photo
was due to the storm surge that typically
accompanies hurricanes. The track of
Hurricane Sandy was an outlier in the
data set. The unusual flooding can be ex-
plained entirely by storm dynamics over
the ocean. A sea-level rise of several
inches due to ice melt would not by itself
cause 20- to 25-foot storm surges.
John T. Curran
(jtcurran41@gmail.com)
Carmel, Indiana
‣ Weart replies: Jonathan Katz worries
about the validity of computer studies of
projected impacts of climate change.
And John Curran notes that illustrations
to my article show particular events,
which computer studies indeed have dif-
ficulty a"ributing individually to climate
change. I apologize if any reader jumped
to the conclusion that a specific a"ribu-
tion was intended. I wanted only to illus-
trate the subject of the article—namely,
impacts in general. Still, part of the sea-
level rise of the past century is reliably
a"ributed to global warming, and the
rise did extend the area of Sandy’s inun-
dation. And a peer-reviewed study has
reported that global warming did con-
tribute to the Texas drought that was
illustrated.
For reasons of length I had to leave
out the interesting story of a"ribution
studies of particular impacts; for a
sketch and references see h"p://www
.aip.org/history/climate/impacts.htm.
Researchers have labored for decades to
test computer models against observa-
tions, and the matches have been good
although imperfect. Anyway, it is not
computers but simply the thermal ex-
pansion of water and the visible decay of
ice sheets that support expectations of
further sea-level rise if greenhouse gas
emissions continue. Other serious im-
pacts have already been observed in
weather statistics, including global in-
tensification of heat waves and of ex-
treme precipitation events.
Finally, Curran misunderstands a
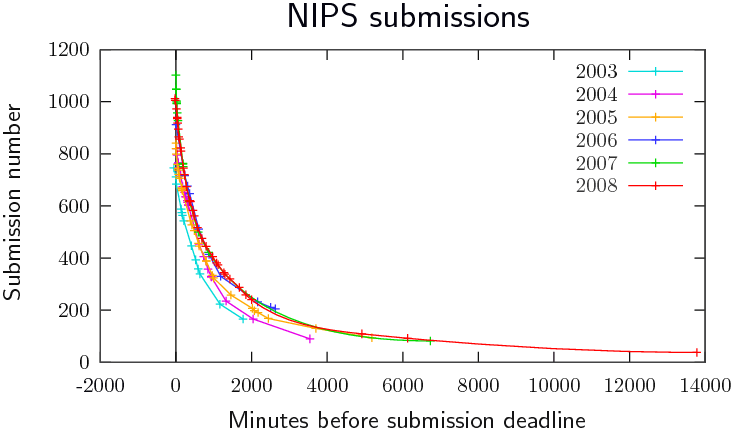
A good example of this behavior can be seen in the number of paper [submissions for Neural Information Processing Systems (NeurIPS)](https://homepages.inf.ed.ac.uk/imurray2/submission_times/), one of the most prestigious machine learning and computational neuroscience conferences in the world.
Is there a strategy to avoid discounting? How can we reverse the psychology of long-term gain to short-term?
The core of the behavioral decision-making approach to time management
is that people discount the value of future outcomes. Time discounting means people prefer to receive a reward sooner rather than later, because the present subjective value placed on a delayed reward decreases as the delay to that reward increases.
People often have to choose between short-term and long-term rewards, and time discounting has major implications for these decisions, for instance: a drug addict chooses between the positive effects of taking a drug and the negative
effects of drug use, such as contagious diseases and loss of employment, in the
future.
Time discounting can have important implications for decisions on how people spend their time. In particular, time discounting can be used to explain the rush before a deadline: it is not very likely that people will work now on a project with a deadline in the far future because people now discount the outcomes that are the results of this project.
Recent research has shown that a hyperbolic function provides a more accurate description of the deadline rush than an exponential.

The difference between hyperbolic and exponential discounting is not trivial: the different shapes have implications for the consistency of preferences.
1) If preferences follow the exponential curve, they are consistent over time (i.e., stationary)
2) If preferences follow the hyperbolic curve, they do not have to be consistent over time and preference reversal can be expected: People prefer a larger but later reward over a smaller but sooner reward when both outcomes are available in the far future (the smaller reward still being available relatively sooner than the larger reward); however, they prefer the smaller but sooner reward over the larger but later reward when some time has passed and the smaller but sooner reward is immediately available. Thus, their preferences reverse by shifting toward the smaller but sooner reward when time goes by.
An example of preferences reversing is a person that prioritizes her tasks on Friday for the coming week based on the hyperbolic discounted value of the tasks. On Monday, even though the plan is to work on some important project
involving a larger but later reward, an e-mail arrives on the inbox and she changes her mind and works to get smaller but sooner rewards and does not work on the important task with the larger but later reward. This is why important but nonurgent tasks are often neglected, unlike urgent but unimportant tasks, which is a topic frequently mentioned in time management self-help books!